
Russia’s export revenues dropped by 6%, to lowest levels since January, due to voluntary production cuts of crude oil
By Vaibhav Raghunandan, Europe-Russia Analyst and Research Writer; Data Scientist: Panda Rushwood; with contributions from Isaac Levi, Europe-Russia Policy & Energy Analysis Team Lead
Key findings
In May 2024, Russia’s monthly fossil fuel export revenues saw a 6% month-on-month drop to EUR 697 mn per day, partly due to a 5% drop in exported volumes and also due to a drop in the price of Russian crude oil.
The drop in crude oil export volumes was also due to Russia’s voluntary production cuts after having exceeded its OPEC + production commitments in April.
Russia’s refining capacity, damaged by Ukrainian drone strikes, recovered sharply in May, with a 12% uptick in oil products export volumes. Russian revenues from exports of seaborne oil products saw an 8% month-on-month increase to EUR 221 mn per day.
India’s month-on-month imports of Russian crude increased by 8% in May to the highest levels since July 2023. Russian crude comprised 41% of India’s total crude imports in May, and with new agreements in place to conduct payments in rubles, the trade might grow significantly over the coming months.
Russian LNG comprised 41% of France’s total LNG imports in May — a 14% increase from last month. In May, Belgium’s total LNG imports rose 11% month-on-month, with imports from Russia increasing by 15% and comprising 66% of their total LNG imports.
In May 60% of the volume of Russian oil and its products was transported on ‘shadow’ tankers. 270 ‘shadow’ tankers with an average age of 16 years facilitated the Russian oil trade. The insurance coverage of these tankers potentially lacks sufficient Protection & Indemnity (P&I) insurance to cover the cost in the event of an oil spill or catastrophe. In case of accidents, EU countries may bear the financial brunt of the cleanup, not to mention the repercussions of damage to their marine ecology.
EU/G7 countries’ insurance still holds significant leverage over constricting Russian oil revenues but damningly, helps undermine sanctions by allowing ship-to-ship (STS) transfers to take place in their coastal waters. These STS transfers enable Russia to split cargoes and obfuscate the origin of the oil by mixing lower-priced Russian oil with non-Russian oil to boost revenues and potentially evade the price cap policy. Almost two-thirds of these transfers (63%) were facilitated by tankers covered by EU/G7 insurance.
A lower price cap of USD 30 per barrel would have slashed Russian revenues by EUR 55 bn (25%) since the sanctions were imposed in December 2022 until the end of May 2024. A USD 30 per barrel price cap would have slashed Russian revenues by EUR 3.5 bn (25%) in May alone.
Trends in total export revenue
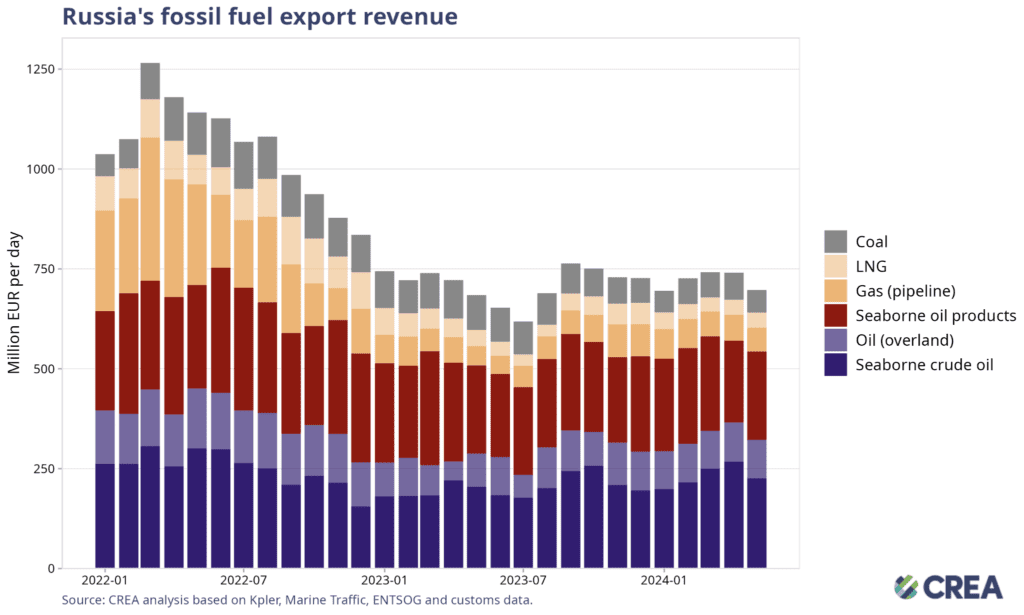
In May 2024, Russia’s monthly fossil fuel export revenues saw a 6% month-on-month drop to EUR 697 mn per day.
Monthly revenues from seaborne crude oil dropped by a massive 15% to EUR 226 mn per day. This was partly due to a 5% drop in exported volumes and also due to a 4–6% drop in the prices of different grades of Russian crude oil.
These drops also aligned with Russia’s voluntary production cuts agreed upon between OPEC+ countries. These cuts were also evidence of Russia compensating for having exceeded its production commitments in April.
This drop in the price of Russian crude also saw revenues from crude oil via pipeline drop by 2% to EUR 95 mn per day, despite there being a barely discernible drop in the volume of exports itself.
In sharp contrast, Russian revenues from exports of seaborne oil products saw an 8% month-on-month increase to EUR 221 mn per day. There was also a significant 12% increase in exported volumes, suggesting that Russia’s damaged refining capacity may have recovered from the Ukrainian drone strikes. Russian refinery runs have gone up by 3% in May to their second-highest levels this year and the highest since the first strikes in February.
In May, Russian LNG export revenues saw a marginal 1% increase to EUR 38 mn per day. This growth can be partly attributed to expanded exports to Asian countries, particularly China, and higher natural gas prices in both Asia and Europe.
Pipeline gas export revenues saw an 8% month-on-month drop to EUR 60 mn per day.
Russian revenues from coal exports saw a massive 17% month-on-month drop to EUR 56 mn per day.
Losing EU gas market has hurt Gazprom’s bargaining power with ChinaRussia’s full-scale invasion of Ukraine and subsequent energy blackmailing of its primary market, the EU, has meant Russia has lost its main markets for gas. As a result, Gazprom, Russia’s state-controlled monopoly, is facing significant financial challenges. Last year, Gazprom reported a staggering 629 billion rubles (USD 6.9 bn) loss — its largest in over a quarter century. The roots of this setback can be traced directly to a sharp decline in gas sales to Europe, which has successfully diversified its energy sources away from Russian gas.
With the European market currently inaccessible, securing the Chinese market through the Power of Siberia-2 pipeline has become critical for Gazprom. This will help mitigate losses and also stabilise finances. However, this strategy faces significant obstacles. In May, China requested that Gazprom sell gas at the same subsidised prices it offers to its domestic market. Additionally, China plans to purchase only a small portion of its natural gas needs through the Power of Siberia-2 pipeline. This puts Russia, and particularly Gazprom, in a challenging position. Even if the expansion into the Chinese market proceeds and the Power of Siberia-2 pipeline is built, profits could be minimal and would make it difficult to compensate for the losses suffered by losing the EU market.
Who is buying Russia’s fossil fuels?
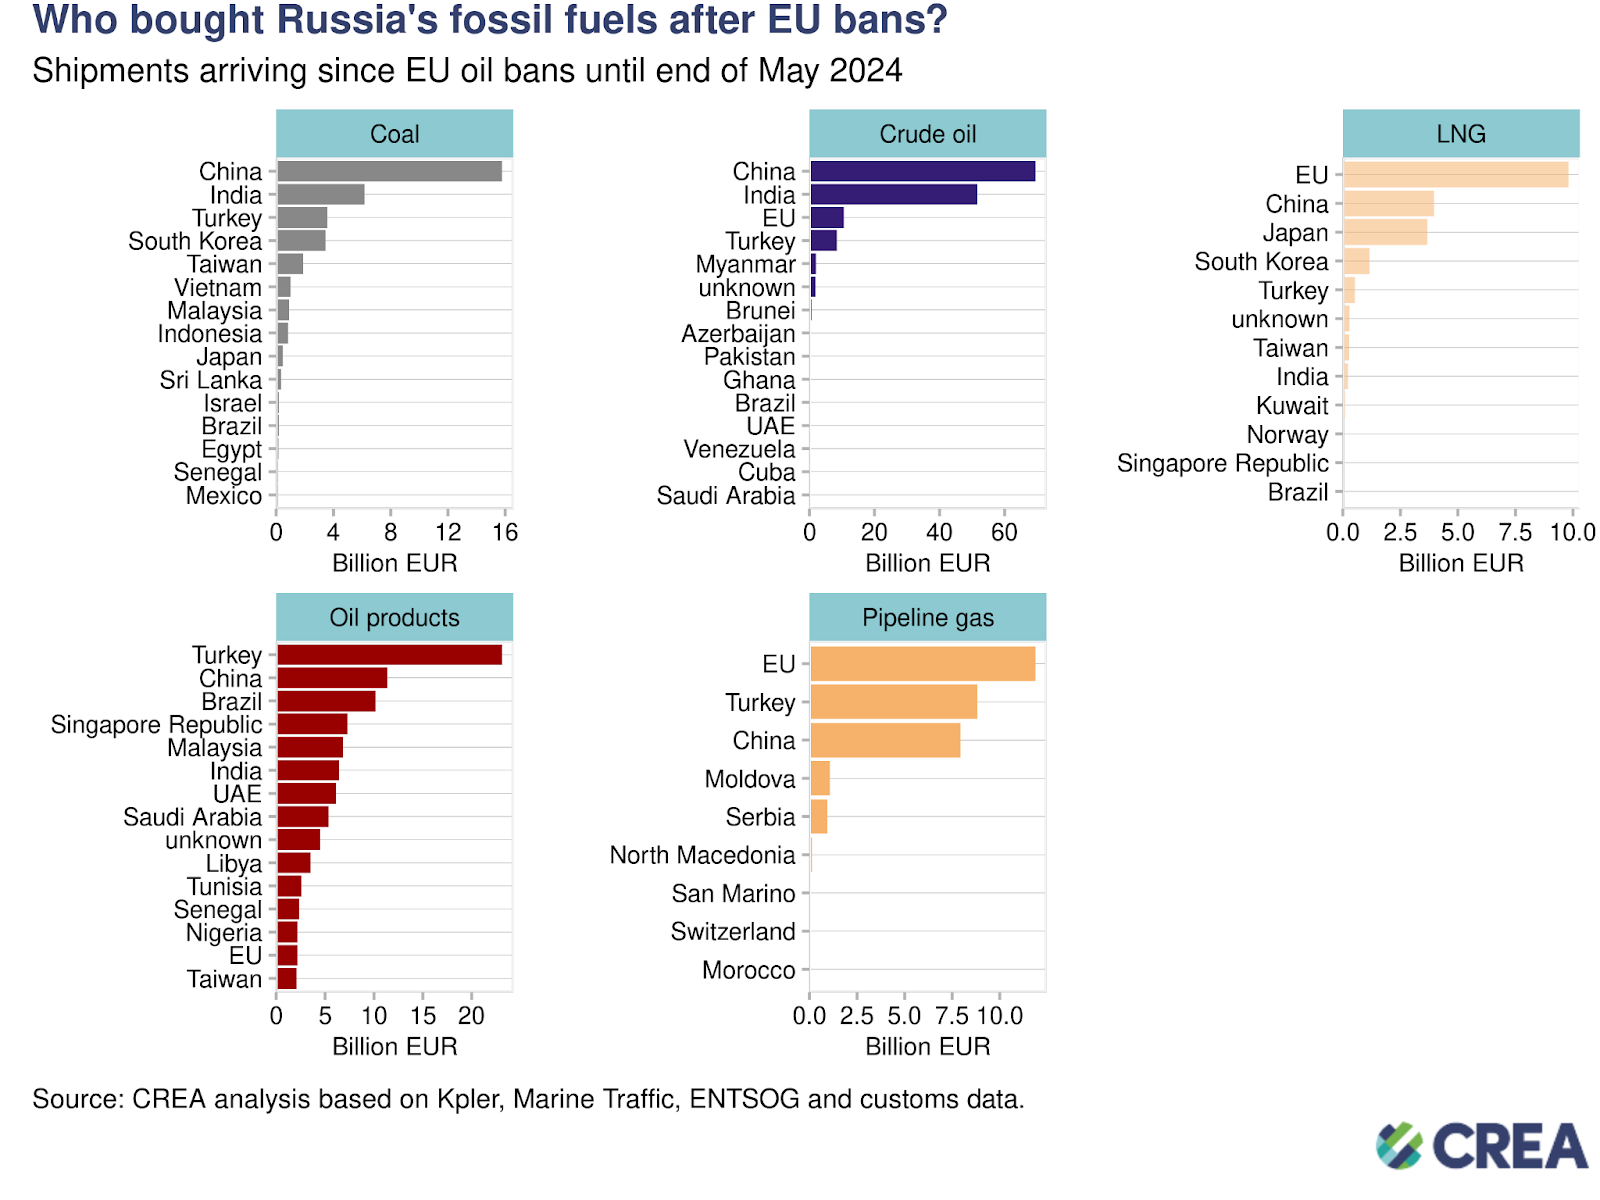

Coal: China has purchased 45% of all Russia’s coal exports from 5 December 2022 until the end of May 2024. They are followed by India (18%) and South Korea (10%). Taiwan rounds off the list, having purchased 5% of all Russian coal exports since the sanctions.
Crude oil: China has bought 48% of Russia’s crude exports, followed by India (35%), the EU (7%), and Turkey (6%).
LNG: The EU was the largest buyer, purchasing 49% of Russia’s LNG exports, followed by China (20%) and Japan (18%). No sanctions are imposed on Russian LNG shipments to the EU.
Oil products: Turkey, the largest buyer, has purchased 24% of Russia’s oil product exports, followed by China (12%) and Brazil (11%). The EU and G7’s sanctions on seaborne Russian oil products were implemented on 5 February 2023.
Pipeline gas: The EU was the largest buyer, purchasing 39% of Russia’s pipeline gas, followed by Turkey (29%) and China (26%).
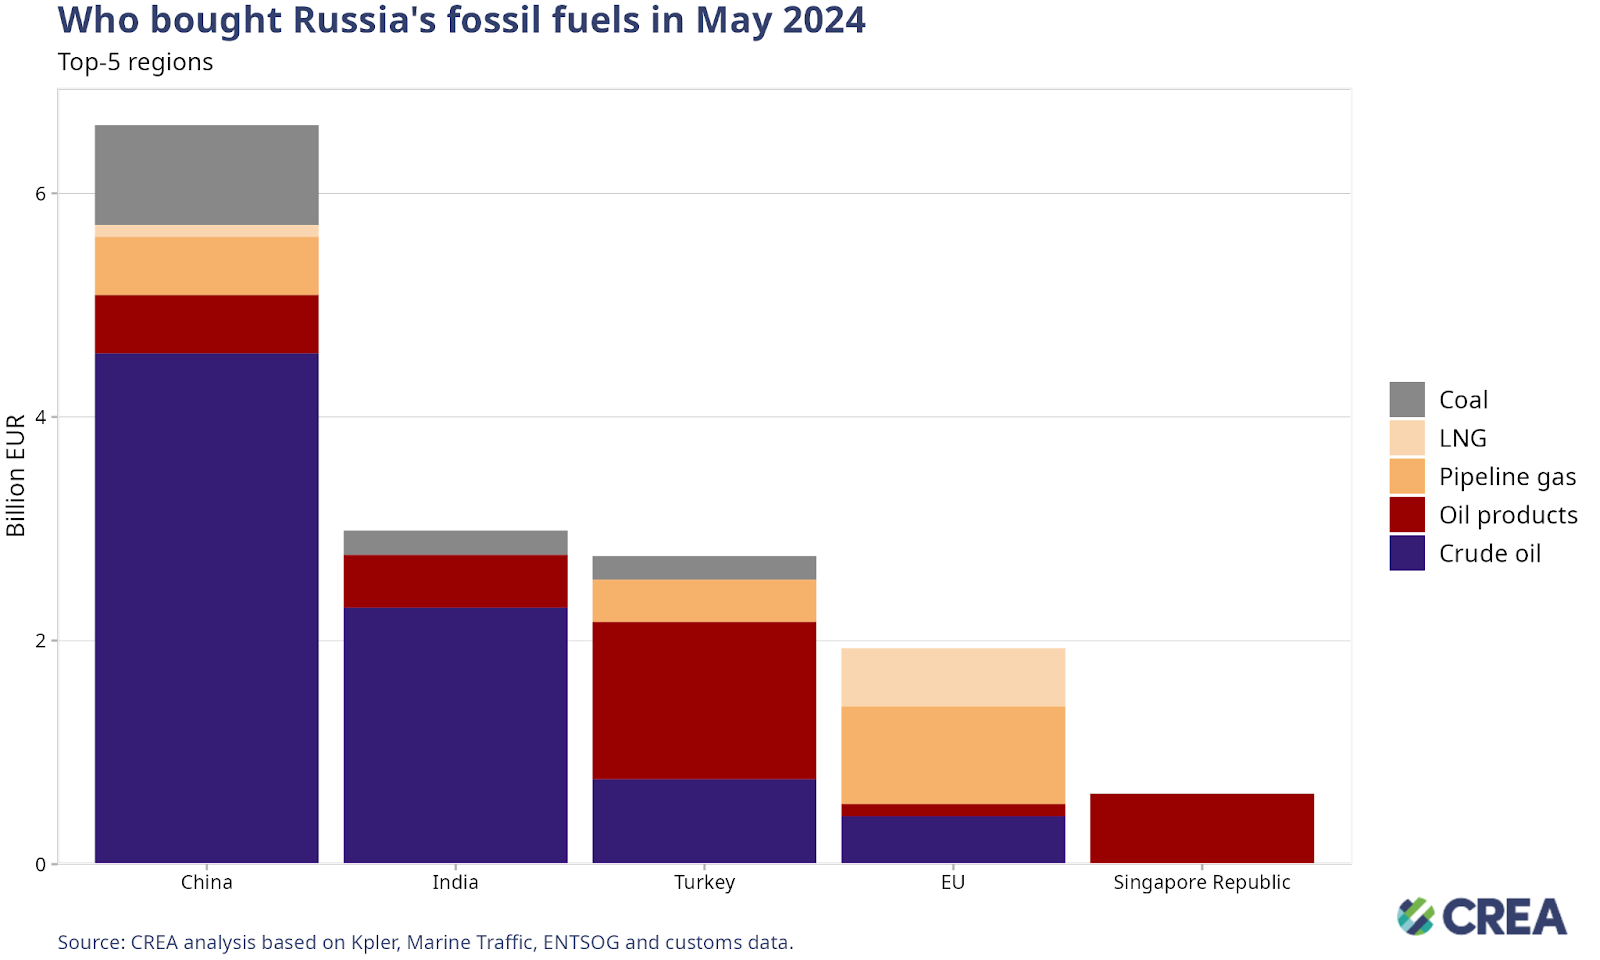

China was the largest buyer of Russian fossil fuels in May, accounting for 44% (EUR 6.6 bn) of Russia’s monthly export earnings from the top five importers. Crude oil comprised 69% (EUR 4.5 bn) of China’s imports from Russia.
India was the second-largest buyer of Russian fossil fuels this month. Over three-quarters of India’s imports (77% valued at EUR 2.2 bn) comprised crude oil. India’s month-on-month imports of Russian crude increased by 8% in May to the highest levels since July 2023. Russian crude comprised 41% of India’s total crude imports in May, and new deals that negate earlier currency disagreements suggest this might grow significantly over the coming months.
Turkey’s imports were the third highest, comprising 18% (EUR 2.7 bn) of Russia’s total export earnings from the top five importers. The majority (51%) of Turkey’s imports from Russia consisted of oil products. CREA and CSD’s recently published investigation suggests that European entities may have imported Russian oil products mixed or re-exported from oil storage terminals in Turkey.
The EU was the fourth largest buyer of Russian fossil fuels in May, their imports accounting for 13% (EUR 1.9 bn) of the top five purchasers. Pipeline gas made up the largest share of the EU’s purchases of Russia’s fossil fuels (45%) followed by LNG (27%) and crude oil via pipeline (22%).
Singapore Republic bought EUR 632 mn of Russia’s fossil fuel exports in May, all comprising oil products.
The EU has granted an exemption for Russian crude oil imported through the southern branch of the Druzhba pipeline to Hungary, Slovakia, and the Czech Republic. Russian pipeline gas and LNG remain unsanctioned. Russia is reliant on EU ports logistically to transship its LNG and re-export to other countries. The EU is discussing a ban on transshipment of Russian LNG to third countries, which could be included in the Union’s 14th sanctions package.
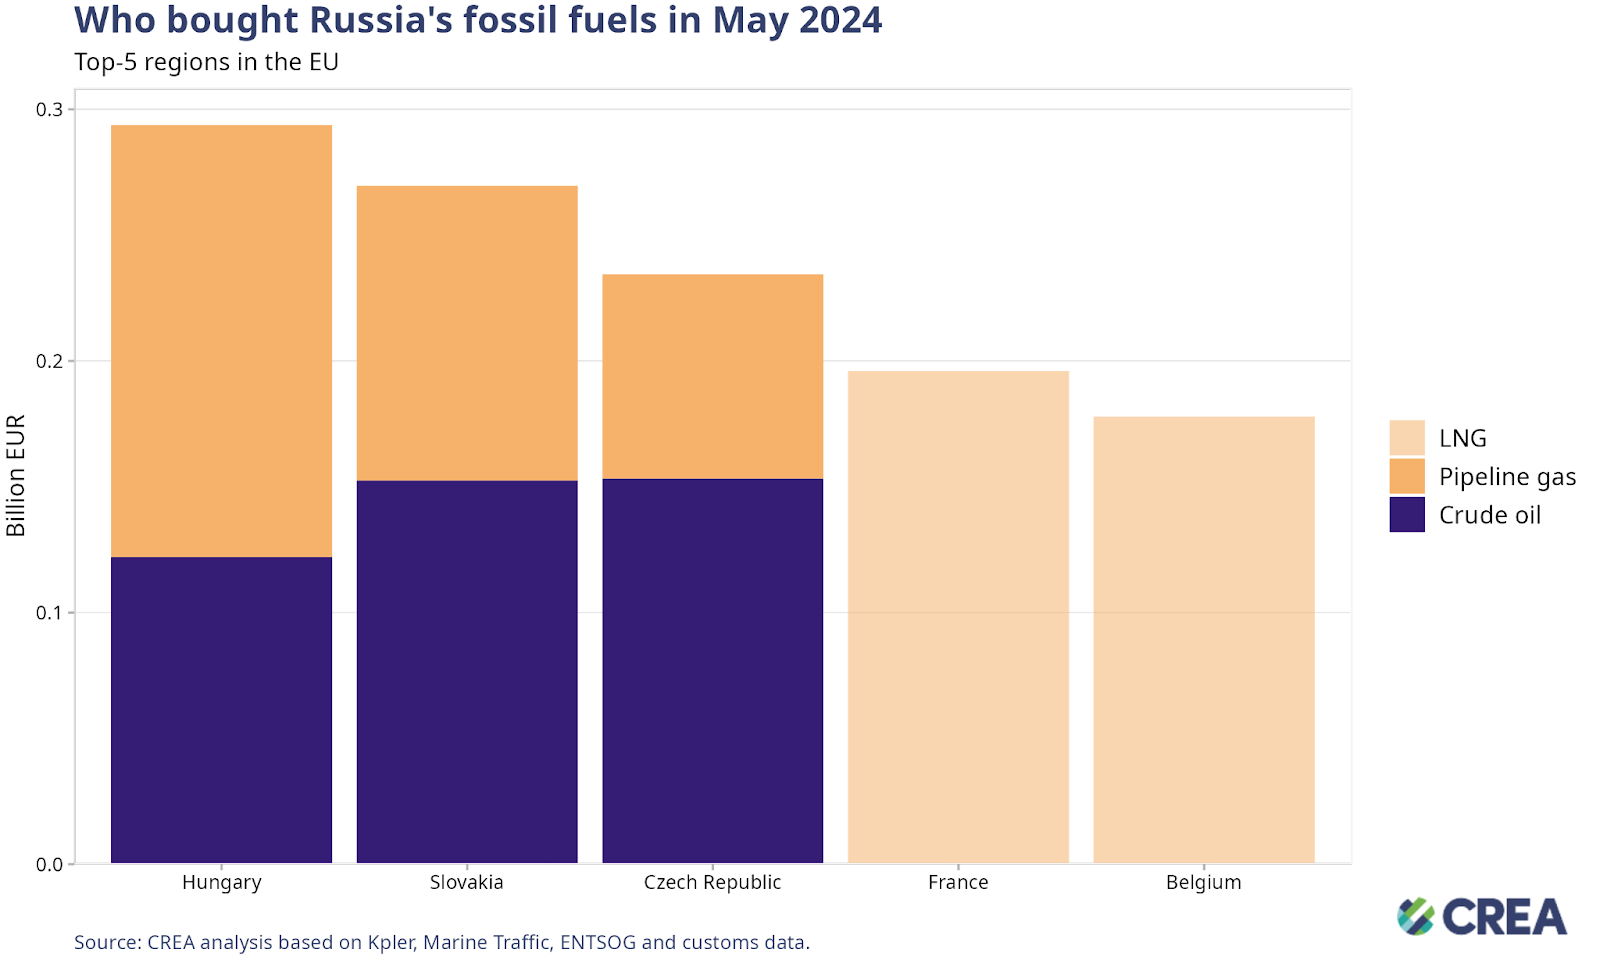
The top five largest Russian fossil fuel importing countries in the EU paid Russia a total of EUR 1.1 billion in May. Member States can continue buying Russian fossil fuels due to exemptions in the sanctions.
Hungary was the largest importer of Russian fossil fuels within the EU in May, importing fossil fuels worth EUR 294 mn. Their imports comprised crude oil and gas, delivered via pipelines, valued at EUR 172 mn and EUR 122 mn, respectively.
Slovakia was the EU’s second-largest importer of Russian fossil fuels in May, purchasing fossil fuels worth EUR 269 mn. Imports included crude oil via pipeline valued at EUR 152 mn and pipeline gas valued at EUR 117 mn.
In May, the Czech Republic was the third largest importer in the EU, importing EUR 234 mn of Russian fossil fuels. Most of their imports (65% valued at 153 mn) comprised crude oil received via pipeline.
France and Belgium rounded off the top five LNG importers, with Russian LNG imports valued at EUR 196 million and EUR 178 million, respectively. Despite an 18% month-on-month decline in France’s total LNG imports in May, imports from Russia increased by 14%, accounting for 41% of the total volume. In contrast, Belgium’s total LNG imports rose 11% month-on-month, with imports from Russia increasing by 15% and comprising 66% of Belgium’s total LNG imports. All the LNG imported by these two countries originated in Yamal, with one transshipment operation occurring at the Montoir-de-Bretagne LNG facility and three transshipment operations occurring in Zeebrugge in May.
How are oil prices changing?
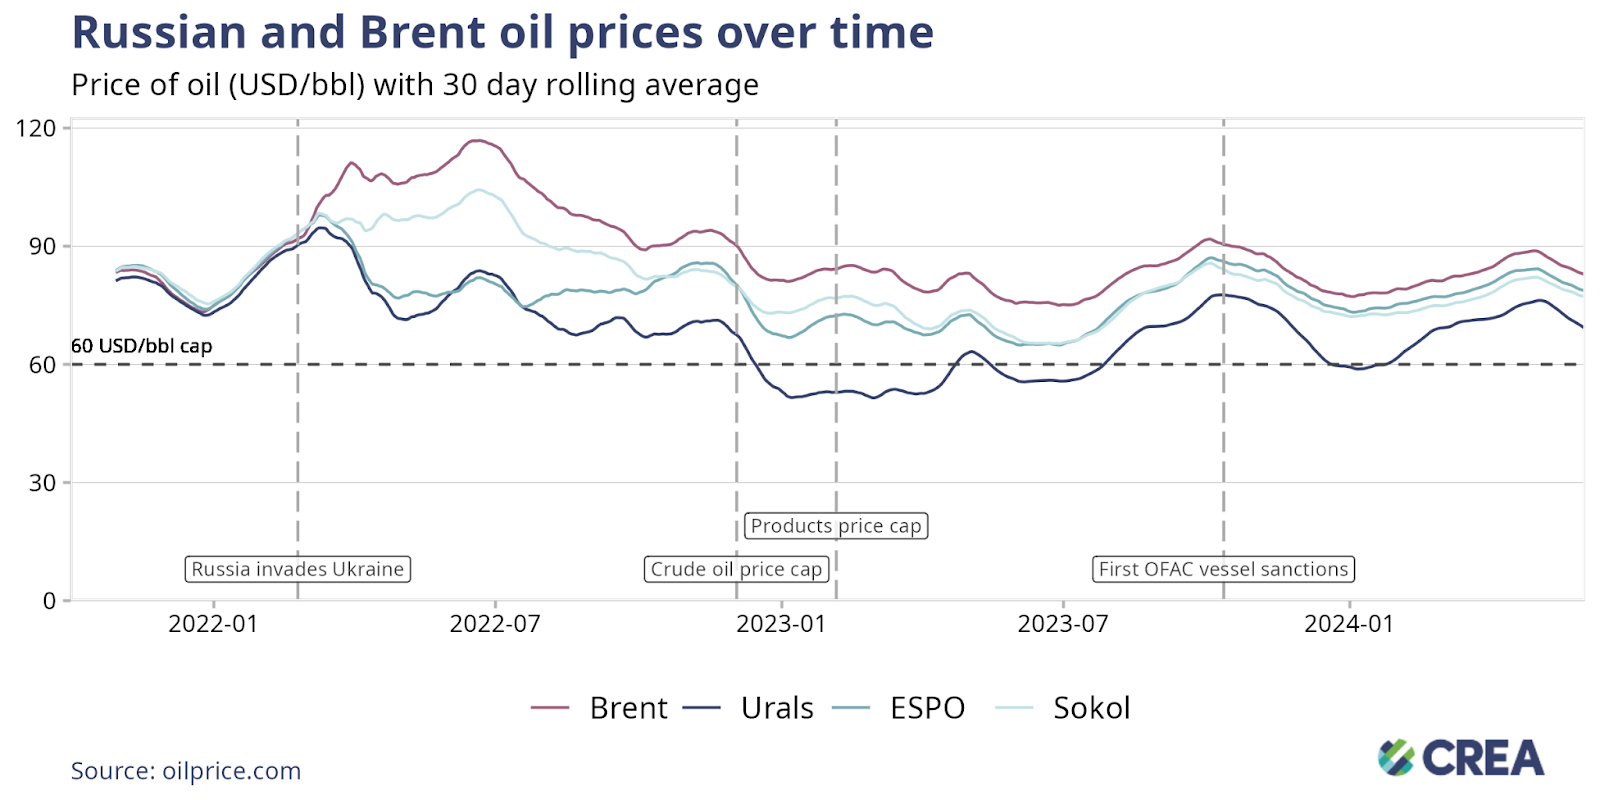

In May, the average Urals spot price saw a 5% month-on-month drop, but was still significantly above the crude oil price cap, trading at USD 73.13 per barrel.
Prices of the East Siberia Pacific Ocean (ESPO) and Sokol blends of Russian crude oil, primarily associated with sales to Asian markets, dropped by 6%.

The discounts on the ESPO grade and Sokol blends remained relatively stable and modest at USD 4.22 per barrel and USD 6.02 per barrel, respectively.
Throughout this period, vessels owned or insured by the G7 and European countries continued to load Russian oil in all Russian port regions where average exported crude oil prices remained above the price cap level. These cases call for further investigation by enforcement agencies for breaches of sanctions.
The Urals grade crude oil was traded at an average discount of USD 12.38 per barrel compared to Brent crude oil.
Russia remains highly reliant on the European and G7 shipping industry
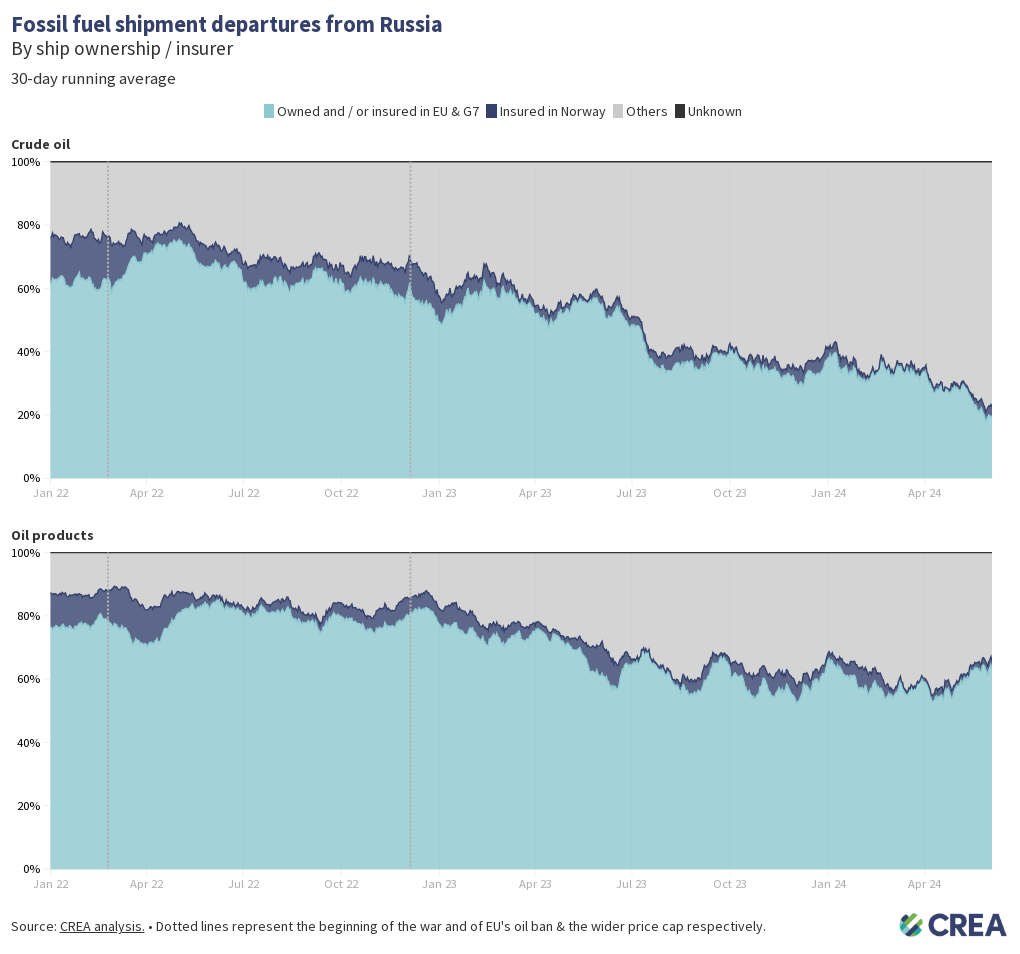

In May, 40% of Russian seaborne crude oil and its products were transported by tankers subject to the oil price cap. The remainder was shipped by ‘shadow’ tankers and was not subject to the price cap policy.
74% of Russian seaborne crude oil was transported by ‘shadow’ tankers, while tankers owned or insured in countries implementing the price cap accounted for 26%.
‘Shadow’ tankers transporting oil products handled 37% of Russia’s total volume of products. The remaining volume was shipped by tankers subject to the price cap policy.
Tankers in the Pacific region were loaded with Russian oil at ports like Kozmino in Russia, where the ESPO pipeline ends and is connected to a Kozmino oil terminal. At this port, the ESPO crude oil grade is exported at prices exceeding the cap.
A recent CREA investigation found that between October and December 2023, no shipments departing the port of Novorossiysk were traded below the price cap. In this period, eight shipments of Urals crude departing from the port were transported on tankers covered by UK P&I insurance. The price cap violations by these eight tankers contributed an additional 27% (GBP 87 mn) in revenue to the Kremlin war chest.
‘Shadow’ tankers pose significant risks to ecology & impact of sanctions
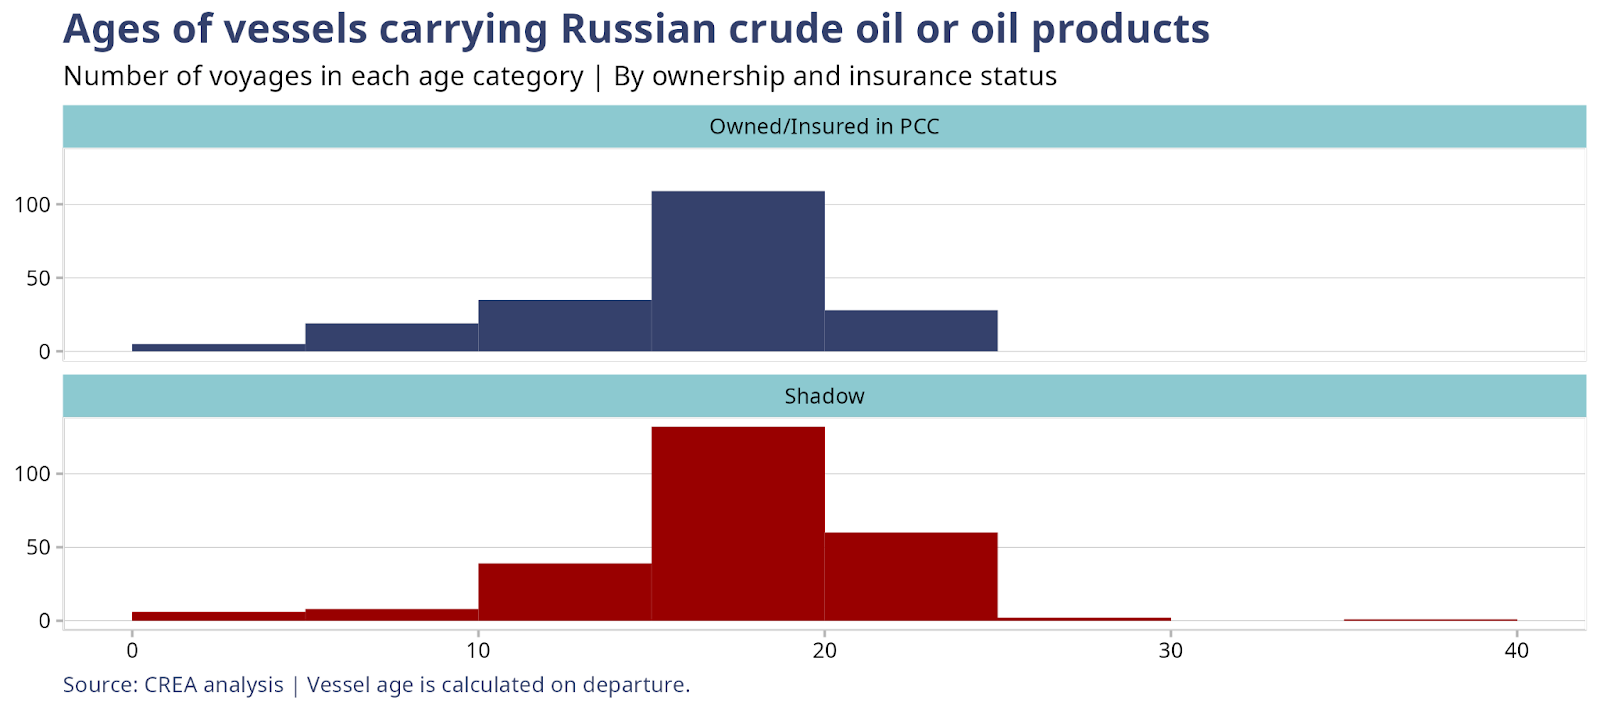

In May, 286 vessels exported Russian crude oil and oil products, of which 213 were ‘shadow’ tankers, with an average age of 17 years. The oldest of these ‘shadow’ tankers was 37 years old, and 25% of these vessels were at least 20 years old.
Older ‘shadow’ tankers transporting Russian oil and petroleum products across EU Member States’ Exclusive Economic Zones, Territorial Waters, or various maritime straits raise environmental and financial concerns due to their questionable insurance coverage. Their coverage potentially lacks sufficient Protection & Indemnity (P&I) insurance to cover the cost in the event of an oil spill or catastrophe. In case of accidents, EU countries may bear the financial brunt of the cleanup, not to mention the repercussions of damage to their marine ecology.
The cost of cleaning up and compensation resulting from an oil spill from tankers with dubious insurance could fall on the coastal country’s taxpayers, amounting to over one billion euros.
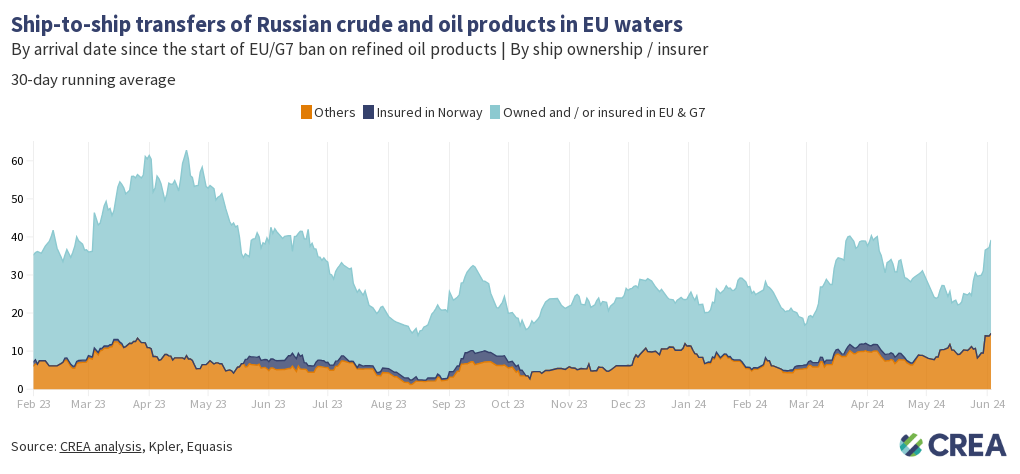

In May, vessels transporting Russian oil or petroleum products conducted ship-to-ship (STS) cargo transfers valued at EUR 700 mn in EU waters.
A majority (63% valued at EUR 444 mn) of these transfers were facilitated by tankers covered by EU/G7 insurance. STS transfers of Russian oil severely undermine sanctions by allowing Russia to evade sanctions and price caps by splitting the cargo to multiple buyers and mixing lower-priced Russian oil with non-Russian oil. STS transfers can be used to obfuscate the origin of the oil to either sell to sanctioning countries or to be transported on EU/G7-owned or insured tankers above the oil price cap level.
‘Shadow’ tankers, which had an average age of 17 years, conducted ship-to-ship transfers totaling EUR 256 mn in EU waters.
How can Ukraine’s allies tighten the screws?
Russia’s fossil fuel export revenues have fallen since the sanctions were implemented, subsequently constricting Putin’s ability to fund the war. However, much more should be done to limit Russia’s export earnings and constrict the Kremlin’s war chest. This includes lowering the oil price cap, increasing monitoring and enforcement of sanctions, and banning unsanctioned fossil fuels such as LNG and pipeline fuels that are legally allowed into the EU.
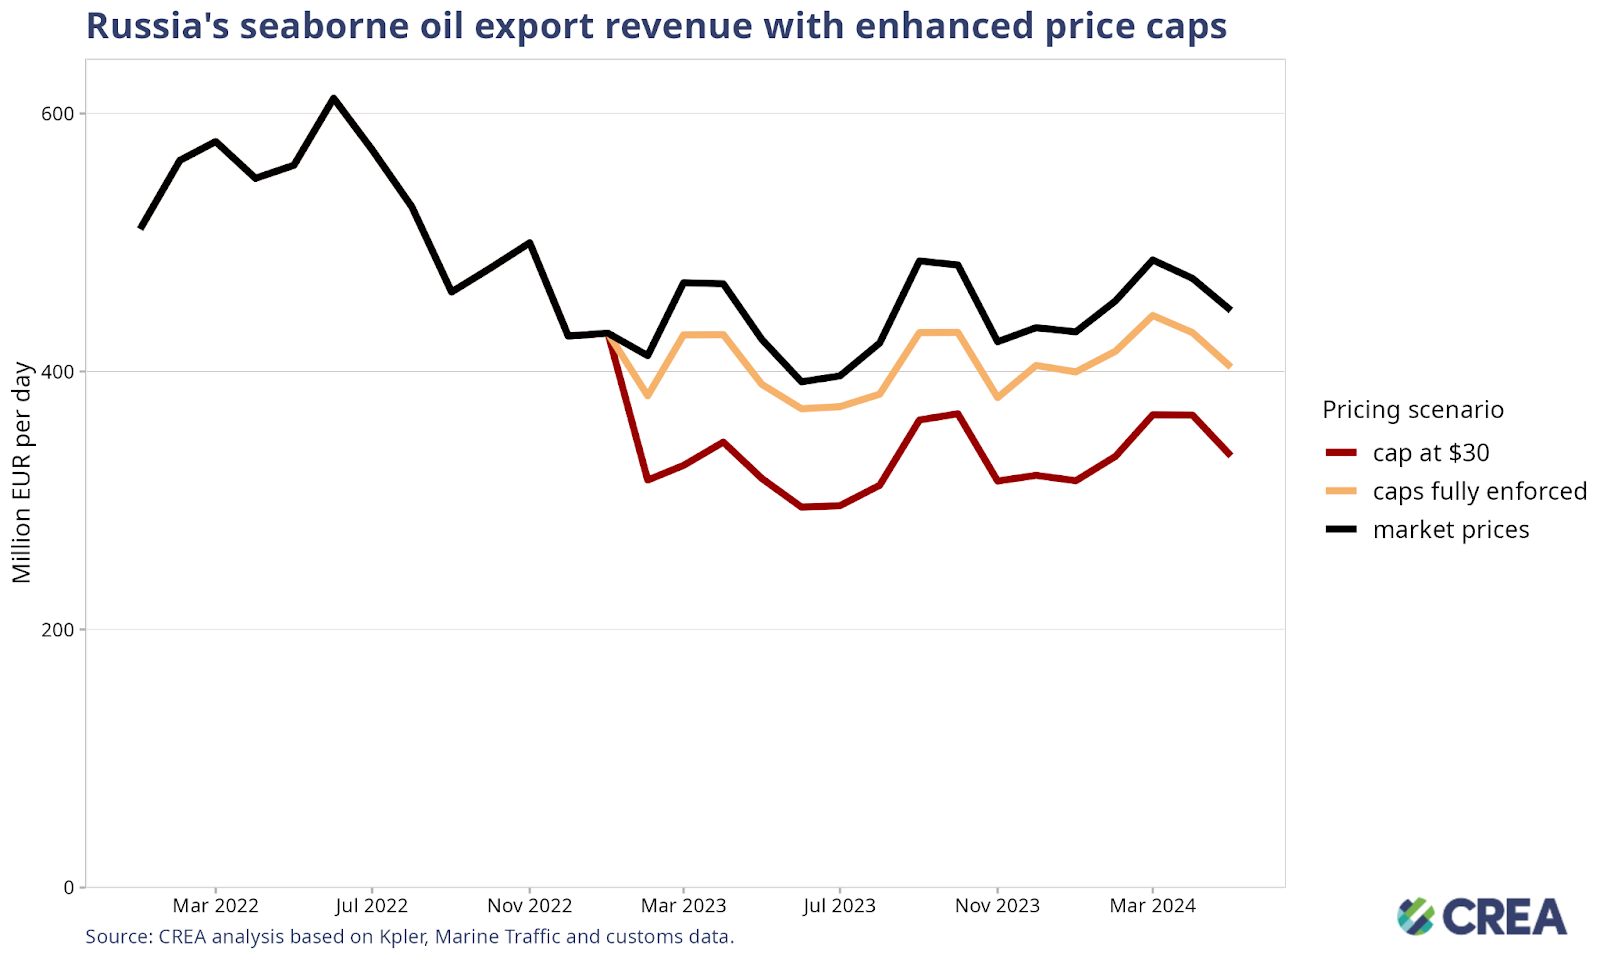
A lower price cap of USD 30 per barrel (still well above Russia’s production cost that averages USD 15 per barrel) would have slashed Russia’s revenue by EUR 55 bn (25%) since the sanctions were imposed in December 2022 until the end of May 2024. A USD 30 per barrel price cap would have slashed Russian revenues by EUR 3.5 bn (25%) in May alone.
Lowering the price cap would be deflationary, reducing Russia’s oil export prices and inducing more production from Russia to make up for the drop in revenue.
Since introducing sanctions until the end of May 2024, thorough enforcement of the price cap would have slashed Russia’s revenues by 8% (EUR 18.5 bn). In May alone, full enforcement of the price cap would have slashed revenues by 10% (approximately EUR 1.36 bn).
Sanctioning countries must prevent Russia’s growth in ‘shadow’ tankers immune to the oil price cap policy. Sanction-imposing countries should ban the sale of old tankers to owners registered in countries that do not implement the oil price cap policy. This would help limit the increase of ‘shadow’ tankers observed since Russia invaded Ukraine.
Russia’s reliance on G7+-countries-owned or insured vessels provides the Price Cap Coalition with adequate leverage to lower the price cap and implement better monitoring and enforcement, which would considerably lower Russia’s oil export revenues.
G7+ countries must plug the refining loophole by banning the importation of oil products produced from Russian crude oil. This would enhance the impact of the sanctions by disincentivizing third countries from importing large amounts of Russian crude and helping cut Russian export revenues. Banning the imports of oil products from refineries that process Russian crude oil would also lower the price of Russian oil as they would struggle to find buyers or expand their market.
Enforcement agencies overseeing the sanctions must take proactive measures against violating entities, including insurers registered in price cap coalition countries, shippers, and vessel owners.
Despite clear evidence of violations, agencies must enforce penalties against shippers, insurers, or vessel owners more, and this information must be shared in the public domain. Penalties against violating entities increase the perceived risk of being caught and serve as a deterrent.
Penalties for those guilty of violating the price cap must be significantly harsher. Current penalties include a 90-day ban of vessels from securing maritime services after violating the price cap, a mere slap on the wrist. Vessels should be fined and banned in perpetuity if found guilty of violating sanctions.
OFAC and the Office of Financial Sanctions Implementation (OFSI) must continue to sanction ‘shadow’ tankers as doing so hinders Russia’s ability to transport its oil above the price cap. CREA estimates that OFAC’s sanctioning of ‘shadow’ tankers has widened the discount Russia offers buyers of its oil and cut Russia’s crude oil export revenues by 5% (EUR 512 mn per month).
The lack of proper monitoring and enforcement and rising oil prices have increased Russia’s export revenues to fund its war against Ukraine.
The G7+ countries should ban STS transfers of Russian oil in EU/G7 waters. STS transfers undertaken by ‘shadow’ tankers pose environmental and financial risks to coastal states and support Russia in logistically exporting high volumes of crude oil. Coastal states should require ‘shadow’ tankers transporting Russian oil through their territorial waters to provide documentation showing adequate maritime insurance. If ‘shadow’ tankers fail to do so, they should be added to the OFAC, OFSI, and European sanctions list. This policy could limit Russia’s ability to transport its oil on ‘shadow’ tankers, which are exempt from complying with the oil price cap policy.
Relevant reports:
Note on methodology:
Update 2023-10-19 – We now use Kpler to estimate seaborne exports from Russia and other countries. This change increases our tracker’s estimate of exports from Russia to the world by EUR 77.8 bn (+18% increase) and the exports to the EU by EUR 12.4 bn (+2.8% increase).We have also changed how we receive protection and indemnity (P&I) insurance information about ships to obtain data from known P&I providers directly and from Equasis. This ensures we have recorded the correct start date for a ship’s insurance.Find out more details on the changes in our methodology explained in our article about the migration from automatic identification system (AIS) data providers to the Kpler dataset.Data used for this monthly report is taken as a snapshot at the end of each month. Data on trades and shipments of oil are revised and verified by the data provider through the month. We subsequently update this verified data each month to ensure accuracy. This might mean that figures for the previous month change in our updated subsequent monthly reports. For consistency we do not amend the previous month’s report, and instead treat the latest one as the most accurate data for revenues and volumes.
Source link : https://energyandcleanair.org/may-2024-monthly-analysis-of-russian-fossil-fuel-exports-and-sanctions/
Author :
Publish date : 2024-06-20 06:00:00
Copyright for syndicated content belongs to the linked Source.