Russia’s export revenues from crude oil rise, as drone strikes effects on refining capacity lead to reduced exports of refined products
By Petras Katinas, Energy Analyst; Data Scientist: Panda Rushwood; with contributions from Vaibhav Raghunandan, Europe-Russia Analyst and Research Writer; and Isaac Levi, Europe-Russia Policy & Energy Analysis Team Lead
Key findings
Monthly export revenues from seaborne crude oil rose 7% to EUR 268 mn per day. This increase can be mostly attributed to a 2% rise in the price of Russian crude oil.
Export revenues from seaborne oil products decreased by 16% month-on-month (EUR 196 mn per day) in April. There was a 19% month-on-month drop in exported volumes, which can be partly attributed to Russia’s reduction in refining capacity following Ukrainian drone strikes. Russia’s refinery runs dropped by 2% in April compared to the prior month.
In April, 38% of Russian seaborne crude oil and its products were transported by tankers subject to the oil price cap — lower than levels observed in March.
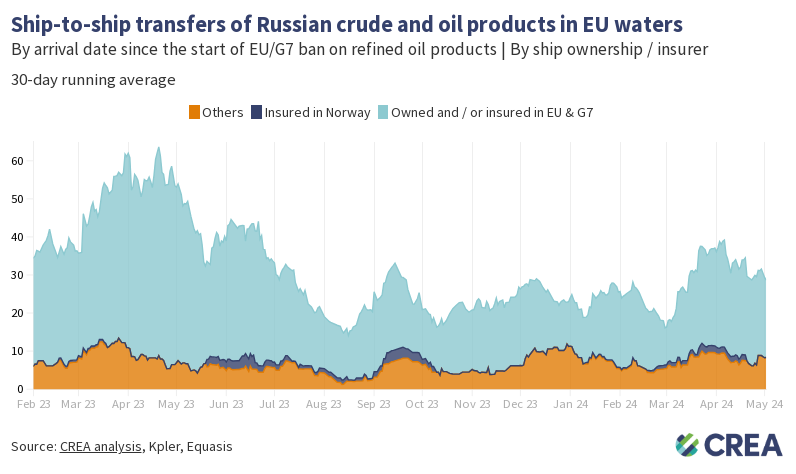
In April, 240 ‘shadow’ tankers, with an average age of 17 years, exported Russian oil and oil products globally. Of these, 64 tankers were 20 years or older. In April, the oldest tanker shipping Russian products was 36 years old. These old tankers with questionable spill insurance coverage are a significant environmental risk, especially when passing through ecologically sensitive waters which could face significant damage in the case of an oil spill.
A lower price cap of USD 30 per barrel would have slashed Russian revenues by EUR 51 bn (24%) since the sanctions were imposed in December 2022 until the end of April 2024. A USD 30 per barrel price cap would have slashed Russian revenues by EUR 3.05 bn (22%) in April alone.
Since introducing sanctions until the end of April 2024, thorough enforcement of the price cap would have slashed Russia’s revenues by 8% (EUR 17 bn). In April alone, full enforcement of the price cap would have slashed revenues by 9% (approximately EUR 1.24 bn).
Trends in total export revenue
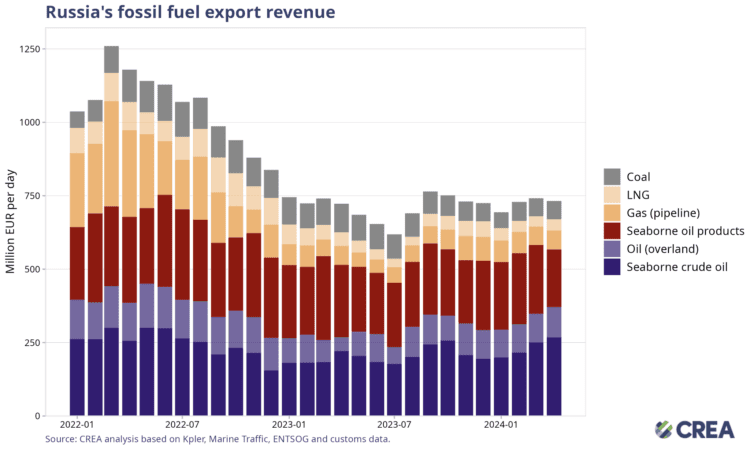
In April 2024, Russia’s monthly fossil fuel export revenues saw a minor month-on-month drop of 1% to EUR 732 mn per day.
Monthly revenues from seaborne crude oil rose 7% to EUR 268 mn per day. This increase can be partially attributed to a 2% rise in the price of Russian crude oil.
Increased price of Russian oil and a higher volume of exports via pipeline allowed Russian revenues from crude oil via pipeline to rise by 5% to EUR 102 mn per day.
Revenues from exports of seaborne oil products saw a 16% month-on-month decrease to EUR 196 mn per day. A similar19% month-on-month drop in exported volumes can be partly attributed to Russia’s reduced refining capacity following the Ukrainian drone strikes. These drone strikes resulted in Russian refinery runs dropping by 2% in April compared to the prior month.
In April, Russian LNG export revenues increased by 8% to EUR 38 mn per day. This growth can be partly attributed to expanded exports to Asian countries, particularly China, and higher natural gas prices in both Asia and Europe.
Pipeline gas export revenues increased by 4% month-on-month to EUR 65 mn per day.
Russia’s revenue from coal exports reached EUR 60 mn per day — a 2% month-on-month increase.
Who is buying Russia’s fossil fuels?
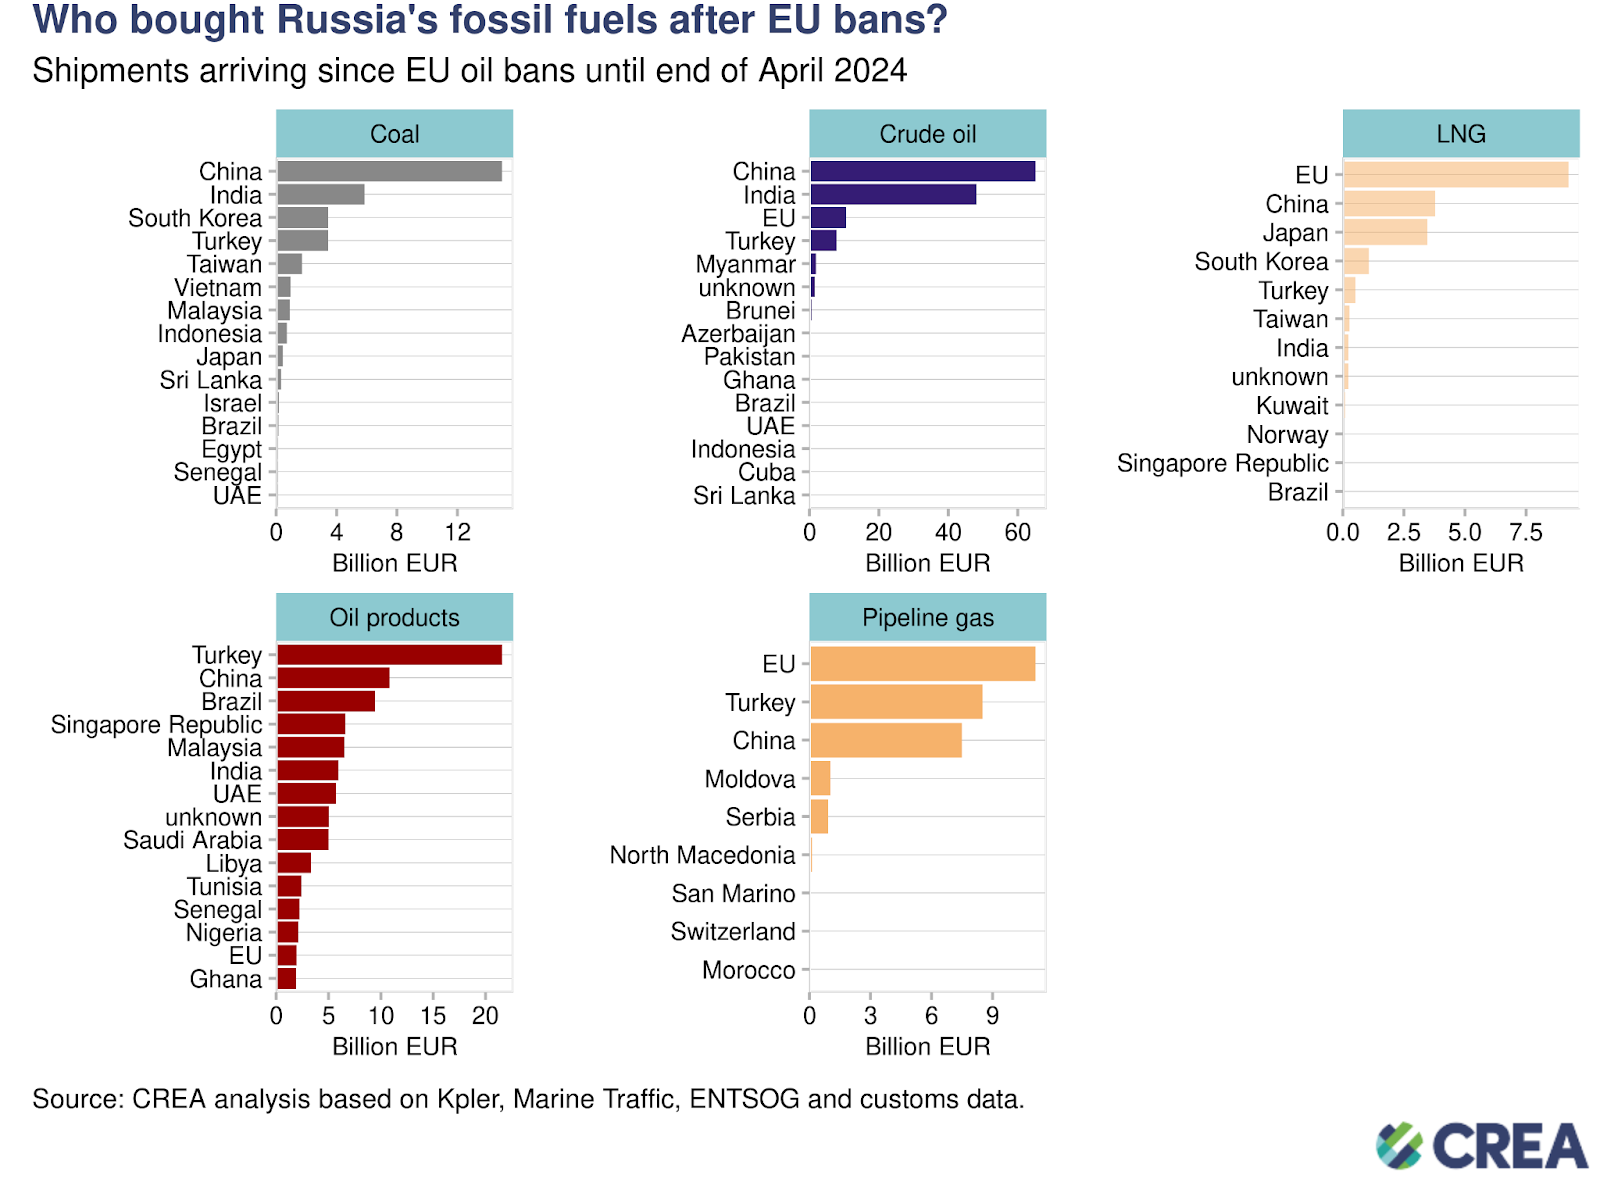
Coal: China has purchased 45% of all Russia’s coal exports from 5 December 2022 until the end of April 2024. They are followed by India (17%) and South Korea (10%).
Crude oil: China has bought 48% of Russia’s crude exports, followed by India (35%), the EU (7%), and Turkey (6%).
LNG: The EU was the largest buyer, purchasing 48% of Russia’s LNG exports, followed by China (20%) and Japan (19%). No sanctions are imposed on Russian LNG shipments to the EU.
Oil products: Turkey, the largest buyer, has purchased 24% of Russia’s oil product exports, followed by China (12%) and Brazil (10%). The EU’s sanctions on seaborne Russian oil products were implemented on 5 February 2023.
Pipeline gas: The EU was the largest buyer, purchasing 38% of Russia’s pipeline gas, followed by Turkey (29%) and China (26%).
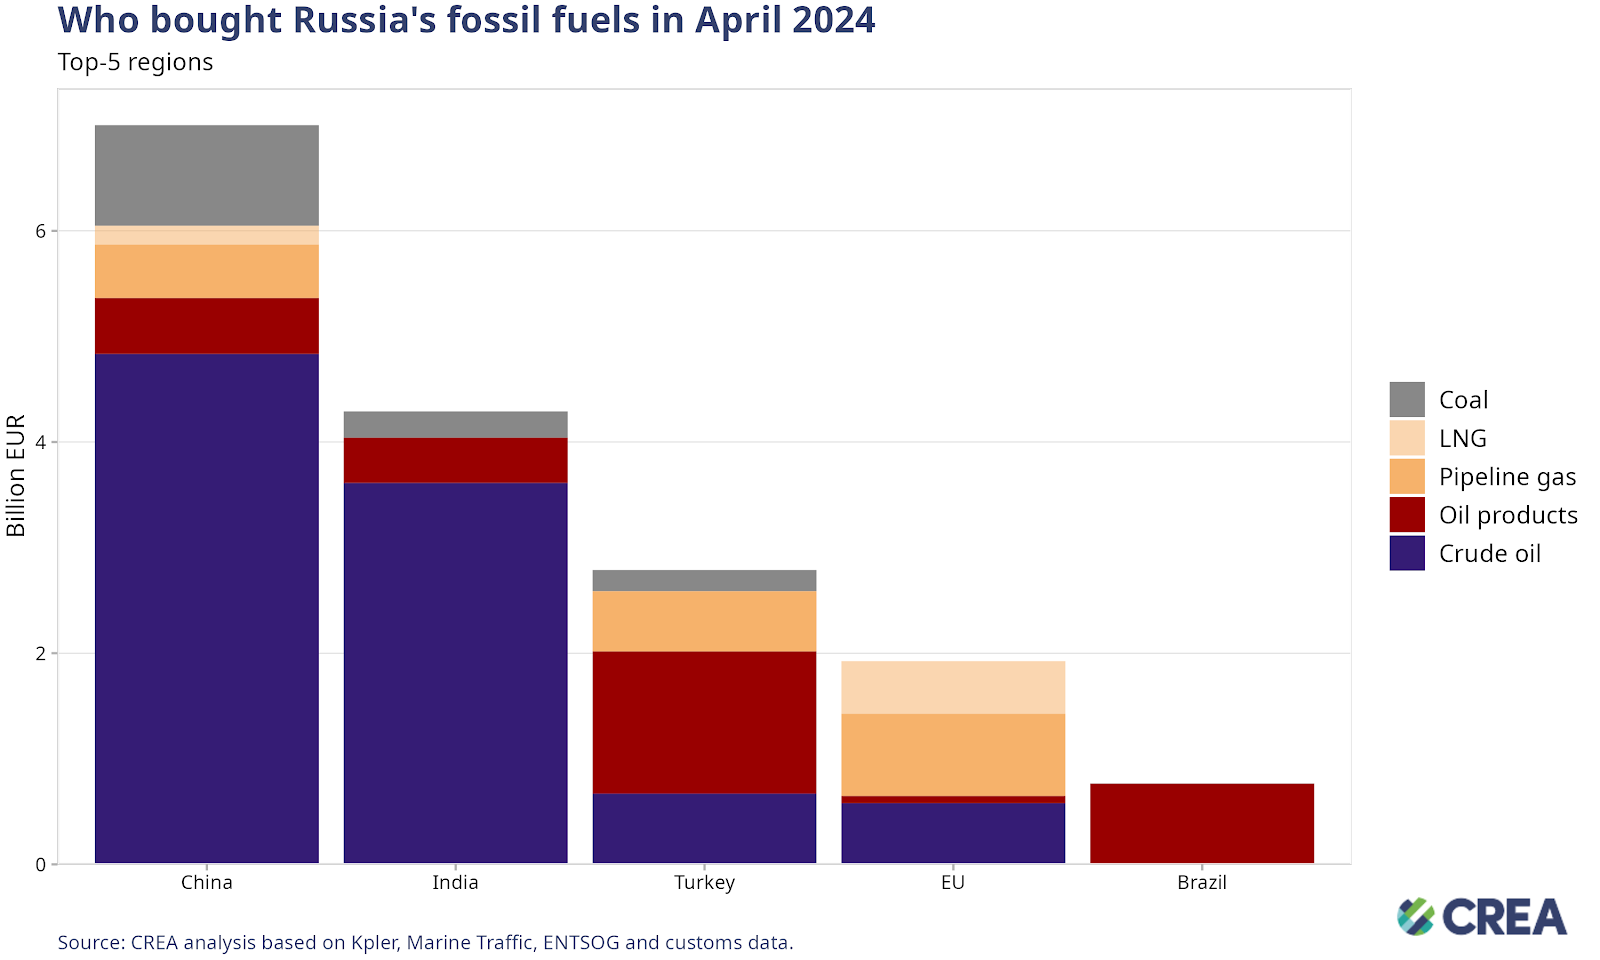
China was the largest buyer of Russian fossil fuels in April, accounting for 32% of Russia’s total monthly exports earnings, valued at EUR 7 bn.
India was the second-largest buyer of Russian fossil fuels this month, accounting for 20% of Russia’s total monthly exports earnings, valued at EUR 4.2 bn.
Turkey’s imports were the third highest, comprising 13% (EUR 2.8 bn) of Russia’s total export earnings. The vast majority of Turkey’s imports from Russia consisted of oil products. CREA and CSD’s joint investigation reveals that since the EU/G7 petroleum products ban took effect on 5 February 2023 until the end of February 2024, the EU has imported EUR 3 bn of oil products from three Turkish ports, Ceyhan, Marmara Ereğlisi, and Mersin, which have no refining hubs and have imported 86% of their oil products from Russia in the same period. The recently published investigation of specific shipments suggests that European entities may have imported Russian oil products mixed or re-exported from oil storage terminals in Turkey.
The EU was the fourth largest buyer of Russian fossil fuels in April, purchasing 9% (EUR 1.9 bn) of Russia’s total export earnings. Pipeline gas made up the largest share of the EU’s purchases of Russia’s fossil fuels (40%) followed by crude oil sent via pipeline (30%) and LNG (26%).
Brazil bought EUR 766 mn of Russia’s fossil fuel exports in April, all of which comprised oil products. Brazil’s purchases of Russian fossil fuels made up 4% of Russia’s total export sales.
The EU has granted an exemption for Russian crude oil imported through the southern branch of the Druzhba pipeline to Hungary, Slovakia, and the Czech Republic. Russian pipeline gas and LNG remain unsanctioned. The EU is discussing a ban on the transshipment of Russian LNG to third countries, which could potentially be included in the Union’s 14th sanctions package.
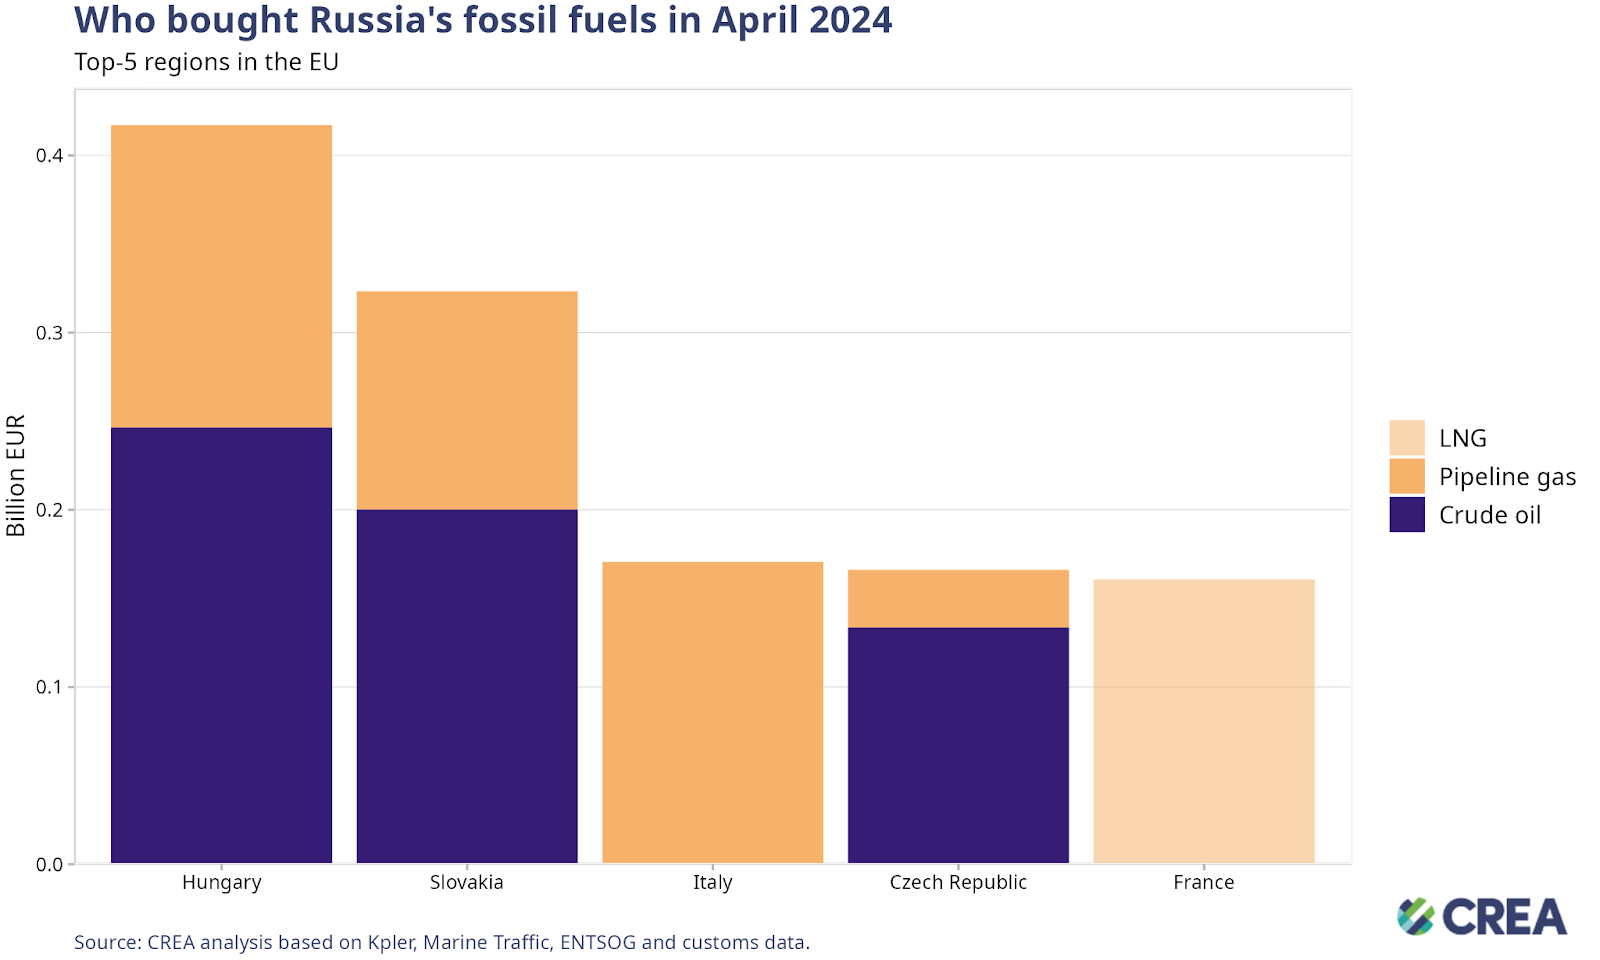
The top five largest Russian fossil fuel importing countries in the EU paid Russia a total of EUR 1.3 billion in April. Member States can continue buying Russian fossil fuels due to exemptions in the sanctions.
Hungary was the largest importer of Russian fossil fuels within the EU in April, importing fossil fuels worth EUR 417 mn. Imports comprised crude oil and gas, delivered via pipelines, valued at EUR 246 mn and EUR 170 mn, respectively.
Slovakia was the EU’s second-largest importer of Russian fossil fuels in April, purchasing fossil fuels worth EUR 323 mn. Imports included crude oil valued at EUR 200 mn and gas valued at EUR 123 mn.
In April, Italy’s imports of Russian fossil fuels consisted solely of pipeline gas valued at EUR 170 mn.
The Czech Republic ranked as the EU’s fourth-largest importer of Russian fossil fuels, buying crude oil valued at EUR 133 mn and EUR 33 mn of pipeline gas.
France was the EU’s fifth-largest importer of Russian fossil fuels. The entirety of their imports consisted of LNG valued at EUR 160 mn.
How are oil prices changing?
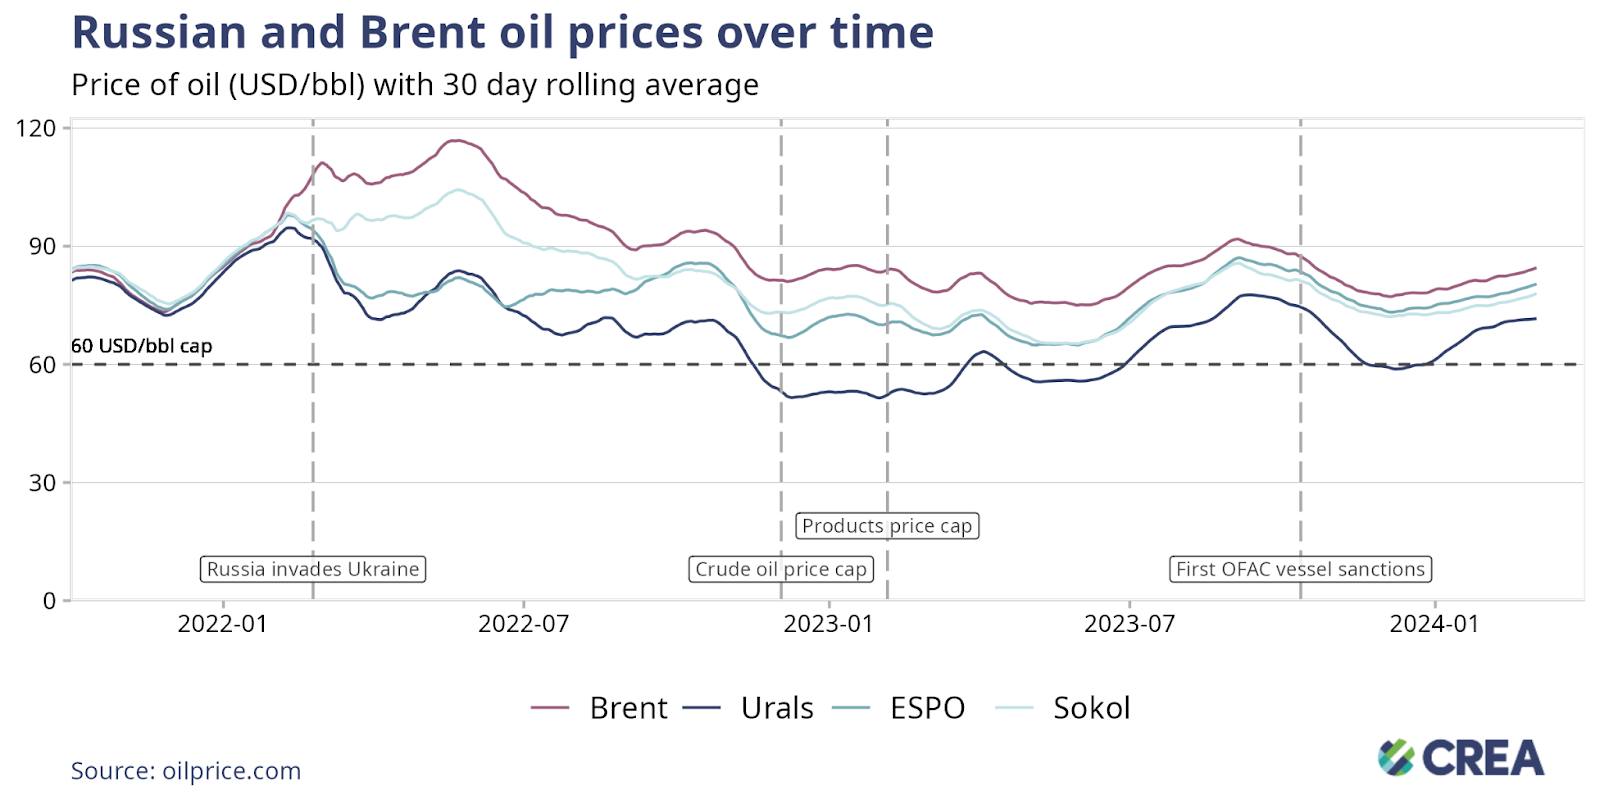
In April, the average Urals spot price rose 3% month-on-month to stay significantly above the price cap of USD 76.12 per barrel.
East Siberia Pacific Ocean (ESPO) prices and Sokol blends of Russian crude oil, primarily associated with Asian markets, rose by 1.6% and 1.9%, respectively.
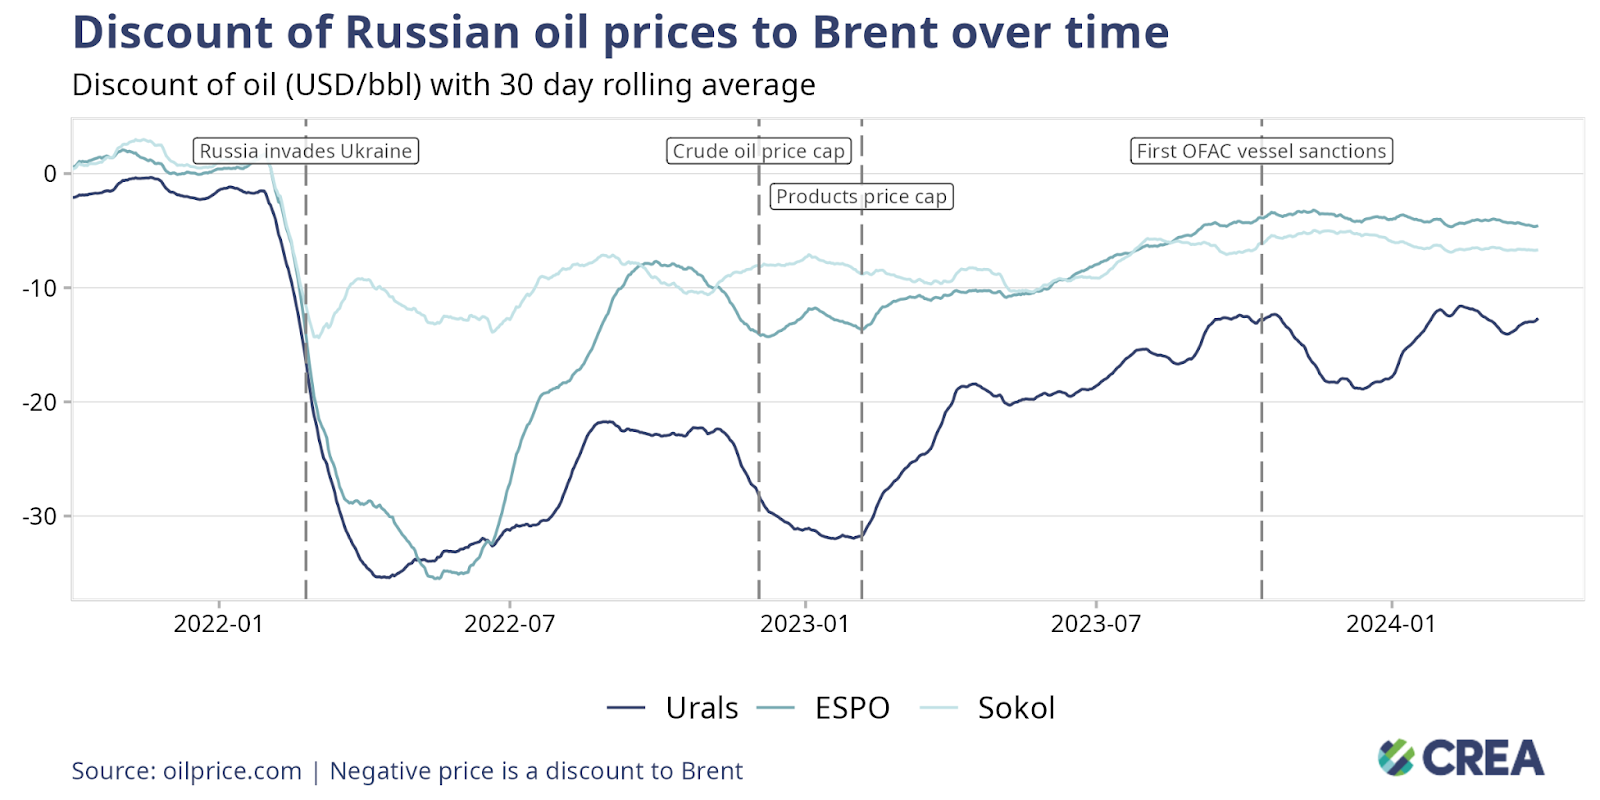
The discounts on the ESPO grade and Sokol blends remained relatively stable and modest at USD 4.56 per barrel and USD 6.69 per barrel, respectively.
Throughout this period, vessels owned or insured by the G7 and European countries continued to load Russian oil in all Russian port regions where average exported crude oil prices remained above the price cap level. These cases call for further investigation for breach of sanctions.
The Urals grade crude oil was traded at an average discount of USD 12.68 per barrel compared to Brent crude oil.
Russia remains highly reliant on the European and G7 shipping industry
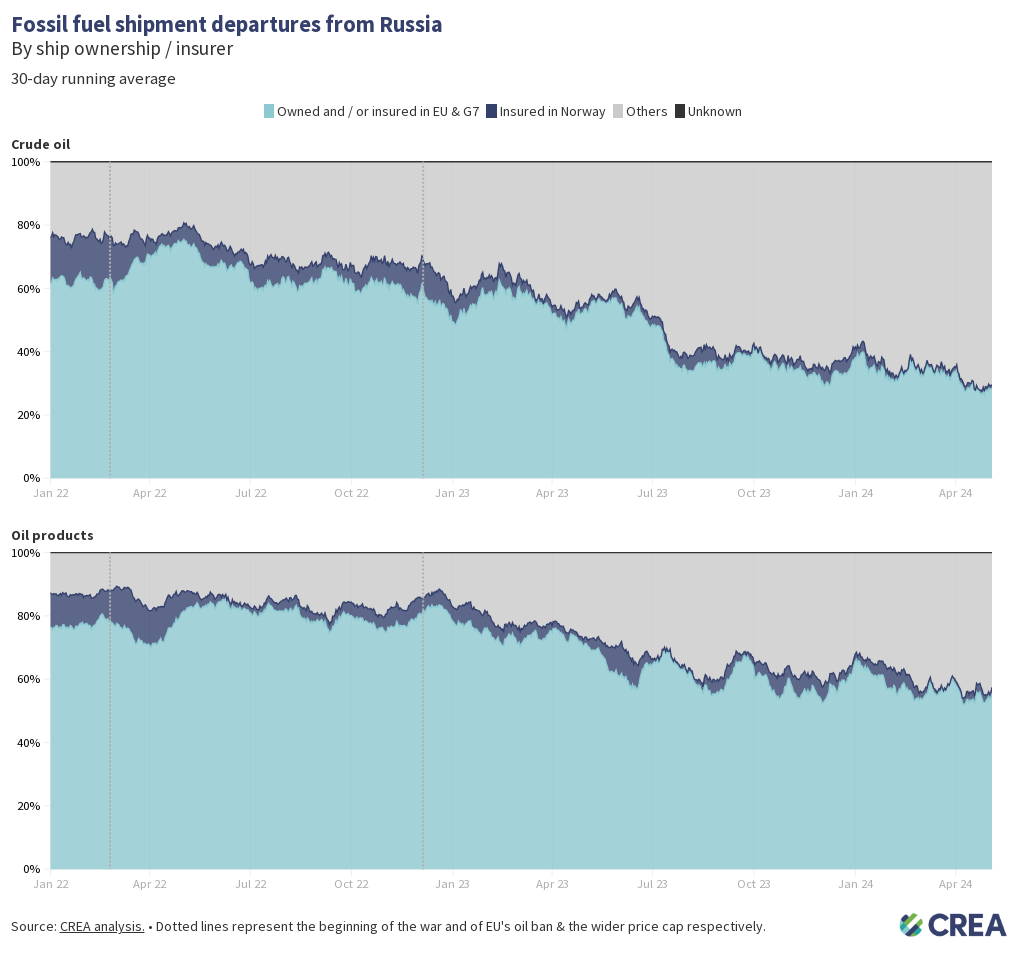
In April, 38% of Russian seaborne crude oil and its products were transported by tankers subject to the oil price cap. The remainder was shipped by ‘shadow’ tankers and was not subject to the price cap policy.
71% of Russian seaborne crude oil was transported by ‘shadow’ tankers, while tankers owned or insured in countries implementing the price cap accounted for 29%.
‘Shadow’ tankers transporting oil products handled 44% of Russia’s total volume of products. The remaining volume was shipped by tankers subject to the price cap policy.
Tankers in the Pacific region were loaded with Russian oil at ports like Kozmino in Russia, where the ESPO pipeline ends and is connected to a Kozmino oil terminal. At this port, the ESPO crude oil grade is exported at prices exceeding the cap.
How safe are ‘shadow’ tankers transporting Russian oil?
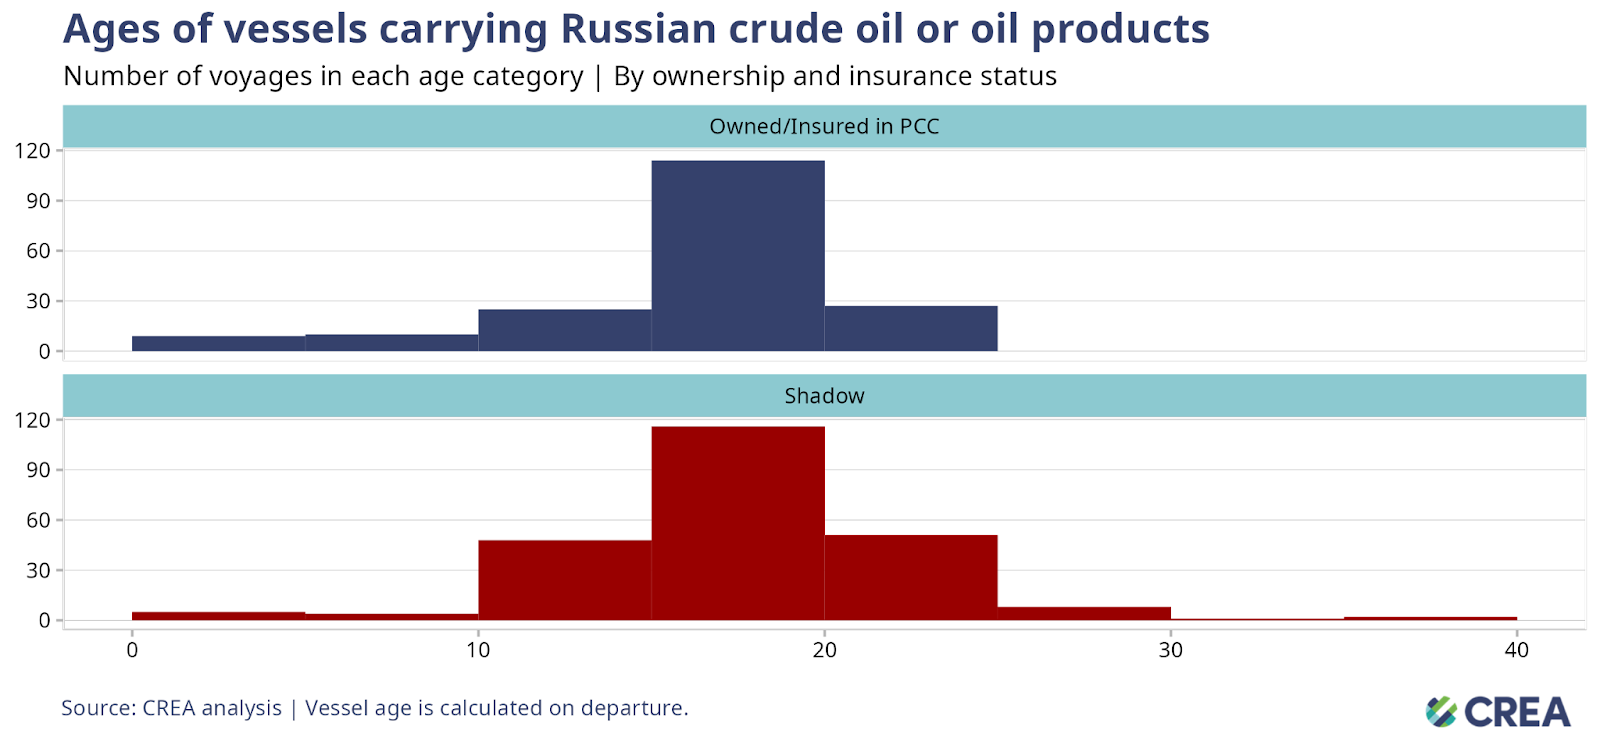
In April, 411 vessels exported Russian crude oil and oil products. Of these tankers, 240 ‘shadow’ vessels, averaging 17 years old, were used to export Russian oil and oil products. Of these vessels 64 tankers were at least 20 years old (in April, the oldest ‘shadow’ tanker transporting Russian oil was 36 years old).
In April, vessels transporting Russian oil or petroleum products conducted ship-to-ship (STS) transfers off the EU coast, amounting to a cargo value of EUR 891 mn. These transfers were facilitated by ‘shadow’ tankers, which had an average age of 19 years. ‘Shadow’ tankers conducted ship-to-ship transfers totaling EUR 206 mn in EU waters.
Older ‘shadow’ tankers transporting Russian oil and petroleum products across EU Member States’ Exclusive Economic Zones, Territorial Waters, or various straits raise environmental and financial concerns due to their questionable insurance coverage. Their coverage potentially lacks sufficient Protection & Indemnity (P&I) insurance to cover the cost in the event of an oil spill or catastrophe. In case of accidents, EU countries may bear the financial brunt of the clean up, not to mention the resultant repercussions of damage to their marine ecology.
A clean-up cost operation and compensation resulting from an oil spill from tankers with dubious insurance could fall on the coastal country taxpayers. This could amount to over one billion euros.
How can Ukraine’s allies tighten the screws?
Russia’s fossil fuel export revenues have fallen since the sanctions were implemented, showing their impact on Russia’s ability to fund the war. However, much more should be done to limit Russia’s export earnings and constrict the Kremlin’s war chest. This includes lowering the oil price cap, increasing monitoring and enforcement of sanctions, and banning unsanctioned fossil fuels such as LNG and pipeline fuels that are legally allowed into the EU.
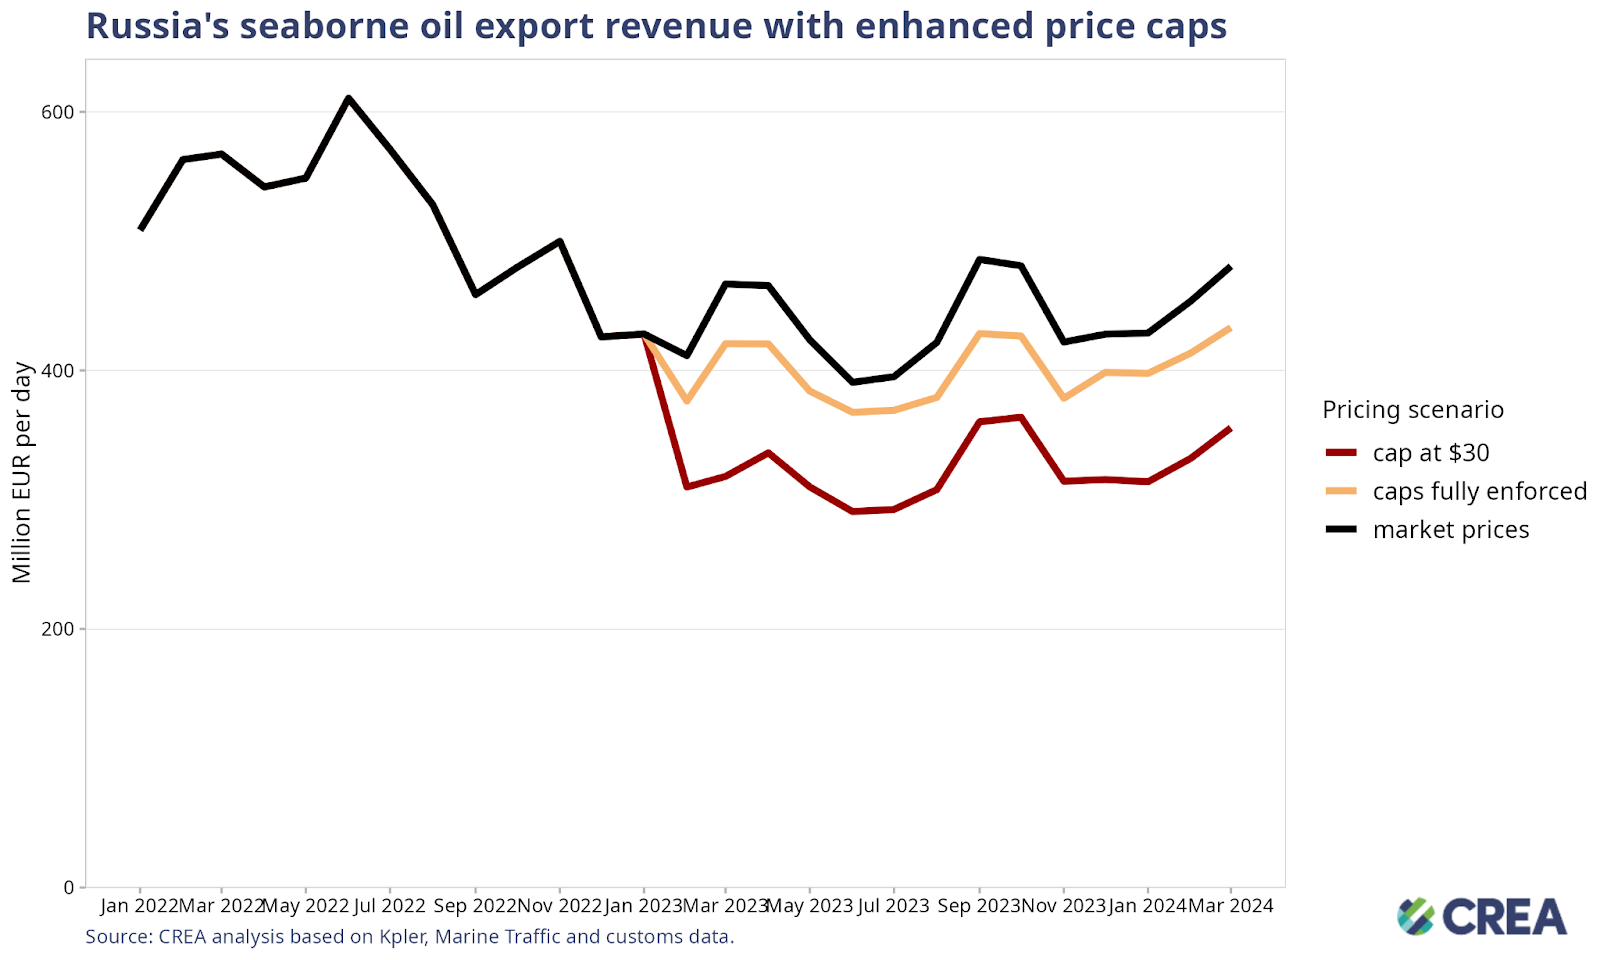
A lower price cap of USD 30 per barrel (still well above Russia’s production cost that averages USD 15 per barrel) would have slashed Russia’s revenue by EUR 51 bn (24%) since the sanctions were imposed in December 2022 until the end of April 2024. A USD 30 per barrel price cap would have slashed Russian revenues by EUR 3.05 bn (22%) in April alone.
Lowering the price cap would be deflationary, reducing Russia’s oil export prices and inducing more production from Russia to make up for the drop in revenue.
Since introducing sanctions until the end of April 2024, thorough enforcement of the price cap would have slashed Russia’s revenues by 8% (EUR 17 bn). In April alone, full enforcement of the price cap would have slashed revenues by 9% (approximately EUR 1.24 bn).
Sanctioning countries must prevent Russia’s growth in ‘shadow’ tankers immune to the oil price cap policy. Sanction-imposing countries should ban the sale of old tankers to owners registered in countries that do not implement the oil price cap policy. This would help limit the increase of ‘shadow’ tankers observed since Russia invaded Ukraine.
Russia’s reliance on G7+ countries owned or insured vessels provides the Price Cap Coalition with adequate leverage to lower the price cap and implement better monitoring and enforcement, which would considerably lower Russia’s oil export revenues.
G7+ countries must plug the refining loophole by banning the importation of oil products produced from Russian crude oil. This would enhance the impact of the sanctions by disincentivizing third countries from importing large amounts of Russian crude and helping cut Russian export revenues. Banning the imports of oil products from refineries that process Russian crude oil would also lower the price of Russian oil as they would struggle to find buyers or expand their market.
Enforcement agencies overseeing the sanctions must take proactive measures against violating entities, including insurers registered in price cap coalition countries, shippers, and vessel owners.
Despite clear evidence of violations, agencies must enforce penalties against shippers, insurers, or vessel owners more, and this information must be shared in the public domain. Penalties against violating entities increase the perceived risk of being caught and serve as a deterrent.
Penalties for those guilty of violating the price cap must be significantly harsher. Current penalties include a 90-day ban of vessels from securing maritime services after violating the price cap, a mere slap on the wrist. Vessels should be fined and banned in perpetuity if found guilty of violating sanctions.
OFAC and the Office of Financial Sanctions Implementation (OFSI) must continue to sanction ‘shadow’ tankers as doing so hinders Russia’s ability to transport its oil above the price cap. CREA estimates that OFAC’s sanctioning of ‘shadow’ tankers has widened the discount Russia offers buyers of its oil and cut Russia’s crude oil export revenues by 5% (EUR 512 mn per month).
The lack of proper monitoring and enforcement and rising oil prices have increased Russia’s export revenues to fund its war against Ukraine.
The G7+ countries should ban STS transfers of Russian oil in EU/G7 waters. STS transfers undertaken by ‘shadow’ tankers pose environmental and financial risks to coastal states and support Russia in logistically exporting high volumes of crude oil. Coastal states should require ‘shadow’ tankers transporting Russian oil through their territorial waters to provide documentation showing adequate maritime insurance. If ‘shadow’ tankers fail to do so, they should be added to the OFAC, OFSI, and European sanctions list. This policy could limit Russia’s ability to transport its oil on ‘shadow’ tankers, which would be exempt from complying with the oil price cap policy.
Relevant reports:
Note on methodology:
Update 2023-10-19 – We now use Kpler to estimate seaborne exports from Russia and other countries. This change increases our tracker’s estimate of exports from Russia to the world by EUR 77.8 bn (+18% increase) and the exports to the EU by EUR 12.4 bn (+2.8% increase).We have also changed how we receive protection and indemnity (P&I) insurance information about ships to obtain data from known P&I providers directly and from Equasis. This ensures we have recorded the correct start date for a ship’s insurance.Find out more details on the changes in our methodology explained in our article about the migration from automatic identification system (AIS) data providers to the Kpler dataset.Data used for this monthly report is taken as a snapshot at the end of each month. Data on trades and shipments of oil are revised and verified by the data provider through the month. We subsequently update this verified data each month to ensure accuracy. This might mean that figures for the previous month change in our updated subsequent monthly reports. For consistency we do not amend the previous month’s report, and instead treat the latest one as the most accurate data for revenues and volumes.
Source link : https://energyandcleanair.org/april-2024-monthly-analysis-of-russian-fossil-fuel-exports-and-sanctions/
Author :
Publish date : 2024-05-20 03:00:00
Copyright for syndicated content belongs to the linked Source.


