
Ozone impacts on bean farming in Uganda
Using crop production data, modelled ozone flux, and localised data on bean growing in Uganda, areas of the country at high risk of production losses due to ozone are highlighted. As the potential yield for beans in Uganda is considerably higher than actual yield17 investigating ozone impacts on bean yield could provide one way to address this yield gap.
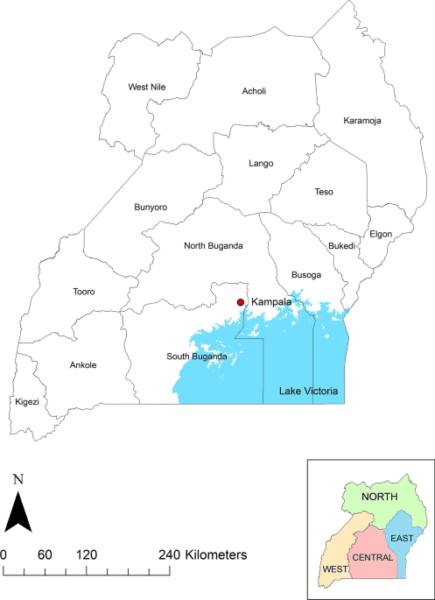
The areas at greatest risk of production losses due to ozone were found to be in the northern sub-regions of Acholi and Lango, the western sub-regions of Ankole and Bunyoro (season 1), and Acholi and Ankole (season 2). Acholi and Lango are mostly self-sufficient in bean production, with some areas of minor deficit16. These losses could potentially be contributing to deficits in some areas, and as the bean farming system in Uganda is predominantly small-scale, individual households could be suffering detrimental effects due to ozone pollution. The highest bean surplus areas are in towns of North Buganda in the central region, and the western region of Uganda also has a minor surplus of bean production18. Bean losses due to ozone in these areas for example, could represent lost opportunities for profits from exporting beans to other areas of Uganda and/or neighbouring countries. The eastern sub-region of Karamoja has a deficit of bean production18. While production losses due to ozone are lower here, the average estimated yield loss is 11%, which could add to the problems already caused by drought and other factors in this sub-region.
Additional stresses
There are areas of the country where multiple crop stresses coincide. In the eastern area with high stress scores (Teso sub-region), there is very little bean production, presumably because farming is unprofitable in this area. However, there are other areas with moderate to high stress scores where beans are being produced, for example West Nile and Acholi. The high levels of deprivation in the country may mean that it is difficult for farmers in rural areas to access improved bean cultivars and the majority of small-scale farmers practice low input farming. The sub-region of Karamoja has not been focused on in this study, however much of the sub-region is currently (as of Jan. 2024) under ‘Crisis’ in the Acute Food Insecurity classification of FEWSNET (https://fews.net/east-africa/uganda), due to climate-related impacts on crop production, endemic pests and diseases and a fragile security situation62. A greater awareness of the impact of ozone on bean production could allow farmers to address the yield gap in areas with high crop stress, using approaches that may not have been previously considered.
Sources of variability
While this analysis uses modelling methods approved for use by the LRTAP Convention49 and data from the widely used EMEP model, there are some sources of uncertainty associated with the methodology.
There are potential differences between the bean production values from the spatial data (SPAM 2017) and the 2018 Ugandan agricultural survey dataset, when sub-regional totals are examined. This is to be expected, as both datasets are based on estimates, from different years, using differing methodologies (modelling and extrapolation vs. surveys of a subset of households respectively). The total estimated production value for beans in Uganda in 2018, from the national survey, was ~ 727,000 tonnes and the SPAM 2017 estimated total was ~ 1 Million tonnes. For further comparison, using data from the Food and Agriculture Organisation of the United Nations (FAOSTAT; https://www.fao.org/faostat/en/), the national bean production total for Uganda in 2015 was 1,079,943 tonnes, in 2017 was 1,012,406 tonnes and in 2018 was 940,323 tonnes. There is some uncertainty in all estimates (and therefore the resulting totals for production losses due to ozone), however the FAO totals suggest that the SPAM dataset is not greatly overestimating production and does reflect production values per sub-region for the time period investigated.
At the time of running the EMEP model for this study, the most up-date-emissions data available were for 2015, while the SPAM dataset was only available for 2010. The 2017 SPAM dataset was subsequently released, therefore as this was the closest time period to the emissions data, this dataset was used to map bean production in Uganda with conversion factors for each region used to convert the 2017 production data to 2015 values per grid cell, based on how production per region had changed between the two national agricultural surveys (2008/09 and 2018). The survey data were used as these are the only datasets providing Ugandan crop production data at a regional scale. While this method uses data on Ugandan bean production to inform how production may have changed, it does not account for smaller scale changes within regions, and fluctuations between 2009–2018. The SPAM production data were at a resolution of 0.083° × 0.083°, while the EMEP data were 0.3° × 0.3°. Therefore, some further variability could arise from using datasets with different resolutions. The use of finer scale ozone data would provide further information on localised patterns in ozone concentration/uptake. The EMEP model is continuously improved and updated, so this should be possible for future studies.
For the current study, the EMEP-WRF model was run for 1 year (2015), due to computational constraints. Ozone concentrations can be expected to vary between consecutive years63, primarily due to variations in weather and, longer term, due to emissions of precursors. Future modelling studies for the African region should be carried out with further years of data, preferably using an average across years, to allow for annual variation in ozone levels. The EMEP modelled data for 2015 in the current study showed the highest ozone concentrations in December (~ 62 ppb) in south-eastern and also central-western areas of Uganda. Ozone concentration in a location does vary between years, due to changes in emissions and also, shorter term, due to weather conditions, so it is not surprising that measured values were slightly higher in 2018/197. The few monitoring studies that have been done in Uganda show that mean ozone concentrations can be high at certain times of the year, particularly in rural locations. As surface ozone is predicted to increase in future decades, for example in equatorial Africa, ozone impacts on crops in Uganda could be greater than estimated in the current study in future years so it is important to highlight the potential damage this pollutant can cause.
When calculating ozone flux for this study, a 90-day accumulation period centred around the ozone sensitive period between anthesis and the end of grain fill was designated for the two growing seasons in Uganda. These periods were chosen to reflect the key growing times across the country, however growing periods (particularly for the second growing season) can vary slightly depending on the area and variety of bean. Also, the harvest time for the Karamoja growing season is broad (August to November). According to the EMEP data, Ugandan ozone concentrations don’t vary greatly between month, however there is some fluctuation. Therefore, there may be some variation in estimates of ozone impact, depending on the 90-day period selected to calculate ozone flux.
The bean flux-effect relationship used here includes data from 7 bean cultivars from around the world, including Pinto, Mbombo and Black Turtle (grown in Kenya) and Orca (grown in South Africa) (See Supplementary Information, Sect. 4). The relationship could be further strengthened by including more cultivars, as different bean cultivars can vary in sensitivity to ozone9. For the case of Uganda, it would also be useful to test the ozone sensitivity of popular cultivars that are grown widely, including those developed by NARO. This would improve estimates of ozone impacts on bean growing in Uganda, and farmers could be informed on which cultivars were more ozone tolerant and could lead to a potential increase in yield.
Ozone impacts on crop production for Sub-Saharan Africa have previously been investigated on a large scale13 and included results for Uganda. While the study used the same modelled O3 dataset from the EMEP WRF model, there were some differences in the results from this large-scale investigation, compared to the current study. Results presented here give an improved prediction of the magnitude of ozone impacts on production in Uganda, and how this varies with growing season. Growing season dates have been refined and a separate season for Karamoja is used. Estimated yield losses for Karamoja for the July to September season were generally lower than for the season used by the previous study13 (Oct-Dec; average difference of 1.24%, +-1.33 sd; range from − 1 to 3%). For production data, the current study used the most up-to-date SPAM dataset (2017), and estimates were considerably higher (compared to the 2010 dataset). Ugandan agricultural survey data on production (per region) and production of beans per growing season (per sub-region) were used, allowing more informed estimates of ozone impacts. Overall, total bean production loss estimates due to ozone for Uganda were higher in the current study (184,000 tonnes), compared to those estimated by the larger scale study13 (86,000 tonnes), and revealed the difference in production losses between the two main growing seasons. Results are provided at a more detailed level than the previous study, allowing discussion of implications of ozone impacts for different areas of the country.
The datasets on additional crop stresses each have their own sources of variability2,51,57,58,61, and time periods vary depending on the data source. Drought levels and dryness vary spatially between years, which can be seen in the SPEI dataset (which provides monthly data for a 35-year period). Therefore, areas where the different stresses coincide will vary with year. The flood occurrence data are annual data and don’t specify when in the year the flood took place, however as floods generally occur in the two Ugandan rainy seasons53, which is also when crops are grown, this is a good indication of risk to crop yield. The stress score calculated is a useful indicator on where crop stress may be particularly high, however it does not account for possible interactions between stresses. For example, there can be interactions between drought and soil stresses such as fertility and toxicities64, and a warming climate is predicted to lead to population growth and increased metabolic rates of insect pests65 (another important crop yield constraint). Water-logged soil can also lead to emergence of diseases and pest damage31.
Mitigation options
There are a number of potential options for reducing ozone impacts on crops. The most effective method would be to lower emission levels of ozone precursors, and global efforts are being made towards this goal.In the Southern African region, the most effective emission control strategy to reduce ozone levels should be CO and VOC reduction, mainly associated with household combustion and regional open biomass burning6. Over 90% of households in Uganda use solid biomass fuel (charcoal) for cooking66. Uganda joined the Climate and Clean Air Coalition (CCAC) in 2021, and there are aims to gather more air pollution data in the country. It would be useful to collect more data on ozone concentrations, particularly in rural areas, during the growing seasons. As hemispheric transport of ozone can occur, the pollutant (and its precursors) can also travel long distances from their sources. Therefore, it is not enough to only consider emissions in the local area, co-operation between countries is required.
There are also other short-term options that can be considered to reduce ozone impacts, for example following particular crop management strategies. With more information on ozone levels in Uganda at different times of the year, it could be possible to time planting to coincide with lower levels of ozone. Currently, levels of crop irrigation in Uganda are low, however the Ugandan government introduced an irrigation masterplan67 in 2017, aiming to increase the irrigated crop area in the country to tackle the effects of climate change. While increasing irrigation can lead to higher levels of ozone uptake by crops, altering the timing and level of irrigation can impact how much ozone is taken into the plants. Reduced irrigation in Kenyan wheat stimulated grain weight and harvest index, which compensated for ozone induced reductions in well-watered plants68.
The International Centre for Tropical Agriculture (CIAT) and its partners, including NARO in Uganda, have developed a range of bean varieties with useful adaptations, including fast growing varieties and those tolerant to particular pests/diseases69. As different cultivars of the same crop show varying sensitivity to ozone, there is also scope for breeding ozone tolerant cultivars. It would, however, be important to balance ozone tolerance with other favourable characteristics.
In terms of mitigating other crop stresses, most farmers in Uganda use low-input practices due to resource constraints16. The primary methods for managing soil fertility include transfer of plant materials from non-cropped areas to arable land, biological nitrogen fixation through legumes and using manure32. Sustainable farming practices, such as conservation tillage, can improve soil water storage and increase the yield of Ugandan beans70. In areas subjected to frequent water-logging of bean crops, Ugandan farmers employ ‘indigenous coping mechanisms’, including planting the crops on ridges and construction of drainage channels31. The provision of weather and climate information could help at-risk communities cope with extreme events such as flooding and farmers do have some strategies available, for example planting early-maturing, water-tolerant crop varieties, however these can be difficult for farmers to obtain71. Using accessible techniques such as adding organic fertilizer and maize-legume intercropping could also help to reduce crop sensitivity to high temperatures72. As agricultural productivity in Uganda remains below its potential, changing practices to mitigate for losses due to ozone pollution, could be another way to reduce the yield gap for bean production and help to improve economic returns for Ugandan farmers. However, more stringent policies to reduce ozone pollution in the region are also required, as some local growers may not have the resources to mitigate impacts.
Source link : https://www.nature.com/articles/s41598-024-58144-1
Author :
Publish date : 2024-04-05 03:00:00
Copyright for syndicated content belongs to the linked Source.